At this point, a lot of digital ink has been spent discussing the benefits of radiant heating and cooling systems in the built environment. Traditional forced-air systems, while cheaper to install, use more energy to properly condition a space. Radiant solutions often recommended by MEP engineering experts because they are more effective in providing and controlling occupant comfort than forced-air systems.
However, there remains a significant hesitation toward integrating radiant technology across building market sectors, due in large part to higher upfront costs of installation. For example, the addition of radiant slabs may add about $10/sq.ft. on average to up-front costs of a traditional mechanical system. However, there are several downline avenues for return on investment that offer owners the opportunity to recoup that cost.
“At $34.19/sq.ft., re-purposing the saved areas as usable leasing space instead of mechanical rooms added up to an additional $302,000 in annual non-energy benefits.”
A major benefit to radiant, which we’ve discovered in our own work, comes from the space saved by reduced equipment size. The use of radiant technologies drives down energy consumption of a building and reduces space taken up by the HVAC system by piping water through the building instead of ducting air. Radiant systems do not completely eliminate the need for ductwork in a building – ventilation is still required by code to bring fresh air into the building. Radiant systems are often coupled with dedicated outside air systems to provide code-required ventilation air to the building, and to decrease the incidence of “dead zones” due to stagnant air. However, the use of radiant technologies drastically decreases the amount of space needed for ductwork as well as associated up-front and installation costs for air-side material. Pipe risers take up less space than shafts at the building core, increasing valuable rentable square footage for building owners. Glumac’s MEP engineering team performed an analysis on the 500,000 sq.ft. Edith Green-Wendell Wyatt building modernization project in Portland, Oregon, and found that using radiant technology saved 8,833 sq.ft. in mechanical space. At $34.19/sq.ft., re-purposing the saved areas as usable leasing space instead of mechanical rooms added up to an additional $302,000 in annual nonenergy benefits. Over the lifetime of a building, this can add up to significant returns.
Radiant cooling and heating involves piping chilled water or hot water through a material that can transfer heat effectively in the space. This method is most commonly extended to chilled sails, in-floor radiant slab, radiant ceiling panels, and radiant walls. Piping water through these materials requires significantly less transport energy than moving air with a forced-air system. Additionally, the air-side of an HVAC system is decreased in a radiant application, thereby decreasing fan and duct sizes, further decreasing the energy usage of the system. This creates sustained and predictable savings on monthly energy bills.
“The radiant heating and cooling system we designed at City Creek Center in Salt Lake City, provides a measured annual energy savings of 24% compared to a typical retail center.”
For example, the radiant system Glumac’s MEP engineering team designed at City Creek Center in Salt Lake City, Utah, provides a measured annual energy savings of 24% compared to a typical retail center in the same climate zone. The main shopping concourse features radiant heating and cooling, designed to condition with natural ventilation, heat with passive solar heating through operable skylights, and provide forced air heating and cooling at the very extreme ambient temperature conditions. The site is in full radiant and natural ventilation mode for 84% of the year, utilizing the forced-air systems for full cooling only 6% and full heating 10% of the year. The radiant system enabled the owner to dramatically decrease the carbon footprint of the site while creating a comfortable shopping environment.
As we continue to push for sustainable building design approaches, the business case remains a crucial part of the conversation. The radiant approach provides various possibilities for return on investment for owners through energy savings and by increasing usable leasing square-footage, as well as reducing space taken up by the mechanical system. But what’s more, this approach comes with the added benefit of increases to occupant health and productivity – a subject we will touch on in part two of this article.
Energy efficiency continues to weave itself into the expectation of building design. Building trades, including Mechanical, Electrical, Plumbing, and Structural Engineers, are having to modify their general practices. The new requirements of building codes, namely energy codes, are subsequently forcing age-old structural detailing into a new realm. Moreover, as designers seek to get the most bang for their buck in their building designs, the integration of structural design with mechanical, electrical, and plumbing (MEP) infrastructure becomes paramount.
High-performance building design requires everyone be around the same table from day one, constantly evaluating the tradeoffs from one concept to another. This article discusses three of the most prominent relationships between structure and energy efficiency: structural type, application of rigid insulation, and the elimination or reduction of thermal bridging.
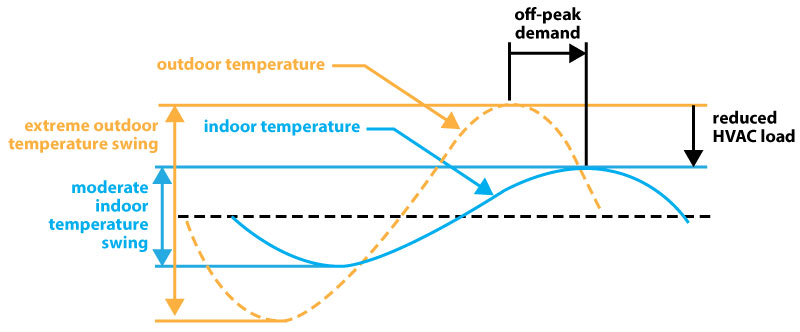
The first step in the design conversation involves the selection of structural materials. In most cases, this is a question of steel or concrete, although high-performance building designs are driving other solutions as well, such as straw-bale construction, structurally-insulated panels (SIPs), phase-change materials (PCMs), and polymer-based 3-D printing. Regardless of the structural material, the concerns associated with thermal massing, thermal breaks, and application of insulation remain the same. For example, a concrete structure has an inherently larger thermal mass capacity than steel-framed structures (because heat dissipates from steel faster than concrete). Thus, concrete can provide exceptional thermal comfort, reduced/delayed peak loads (Figure 1), and improved energy efficiency when applied properly. Of course, span length, seismic weight, commodity pricing, and other issues can override these concerns, which forces decisions regarding structural type. Design teams must consider their local climate to drive material selection. Milder climates, for example, tend to support low thermal mass, while more extreme climates tend to support (properly applied) high thermal mass.
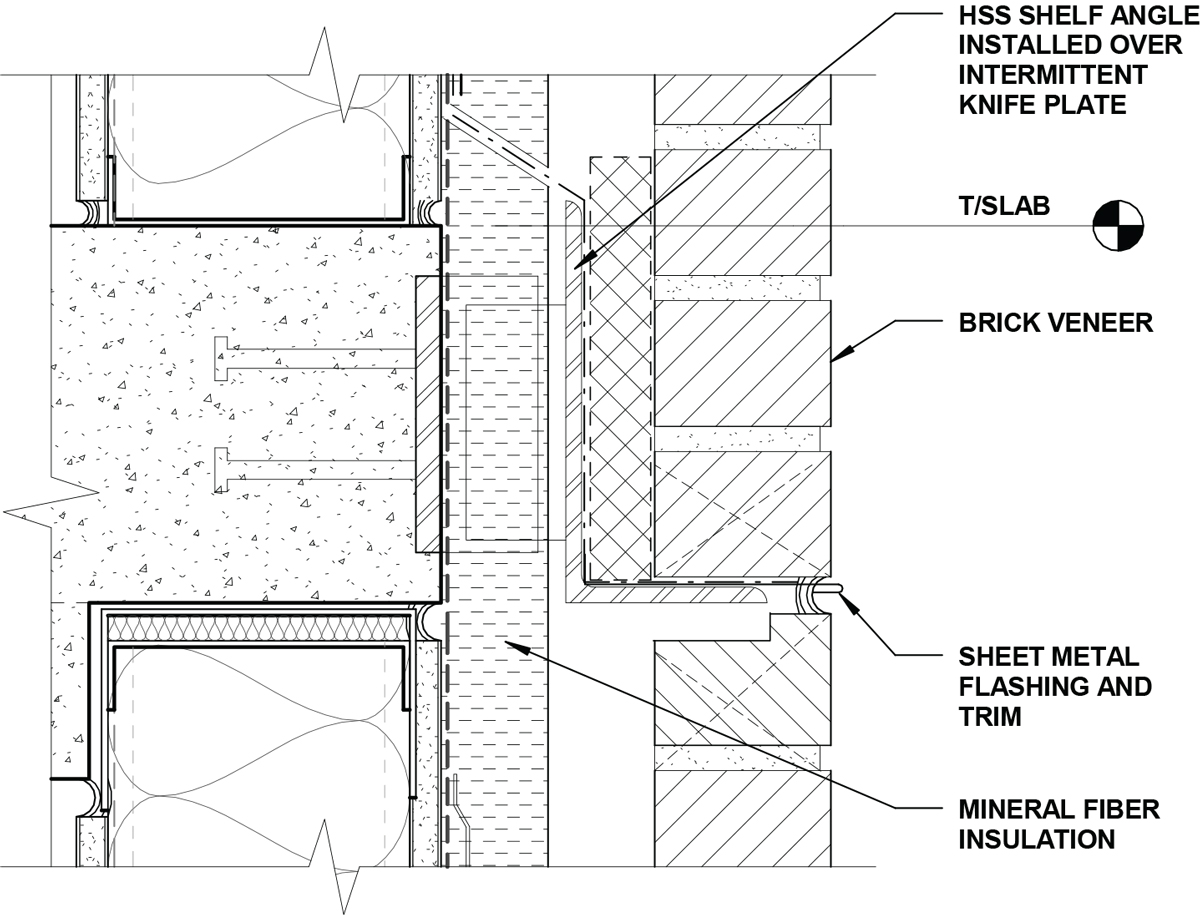
The default response is to add more insulation to drive down energy usage in buildings. The traditional application of fiberglass batt insulation becomes limiting because increased thermal resistance values (R-values) demand thicker walls. A point of diminishing return is reached quickly as usable floor area is decreased and wall thicknesses require significantly more structure to stand up. Theoretically, the “silver bullet” solution to this challenge is the application of rigid insulation. It has about twice as much R-value per inch as traditional batt insulation and can maintain a relatively similar thermal performance, regardless of the structure type, due to its theoretically “continuous” application that is not disrupted by structural members. On paper, this is easy to visualize, and the R-value numbers look great; however, the reality of its application in the field is not so straightforward. For example, the 2012 International Energy Code (IECC) expects a U-value of 0.079 Btu/hr-sf-°F as a prescriptive minimum for metal stud walls. With a 2×6 metal stud wall, this equates to approximately R-21 batt insulation between studs with 1.5 inches of rigid insulation applied to the exterior. Not only can this target U-value not be reasonably achieved in metal stud walls without the integration of rigid insulation, but the choice of exterior finish can have additional structural challenges. If plaster is applied as the exterior finish, then all is good. If brick is applied, then the face of the wall is upwards of 5 to 6 inches away from the supporting studs, with the heaviest part (brick) at the furthest point (Figure 2). This conundrum either forces the designers to dramatically increase the structural elements, such as shelf angles and the detailing associated with this assembly, or select different materials and assemblies altogether.
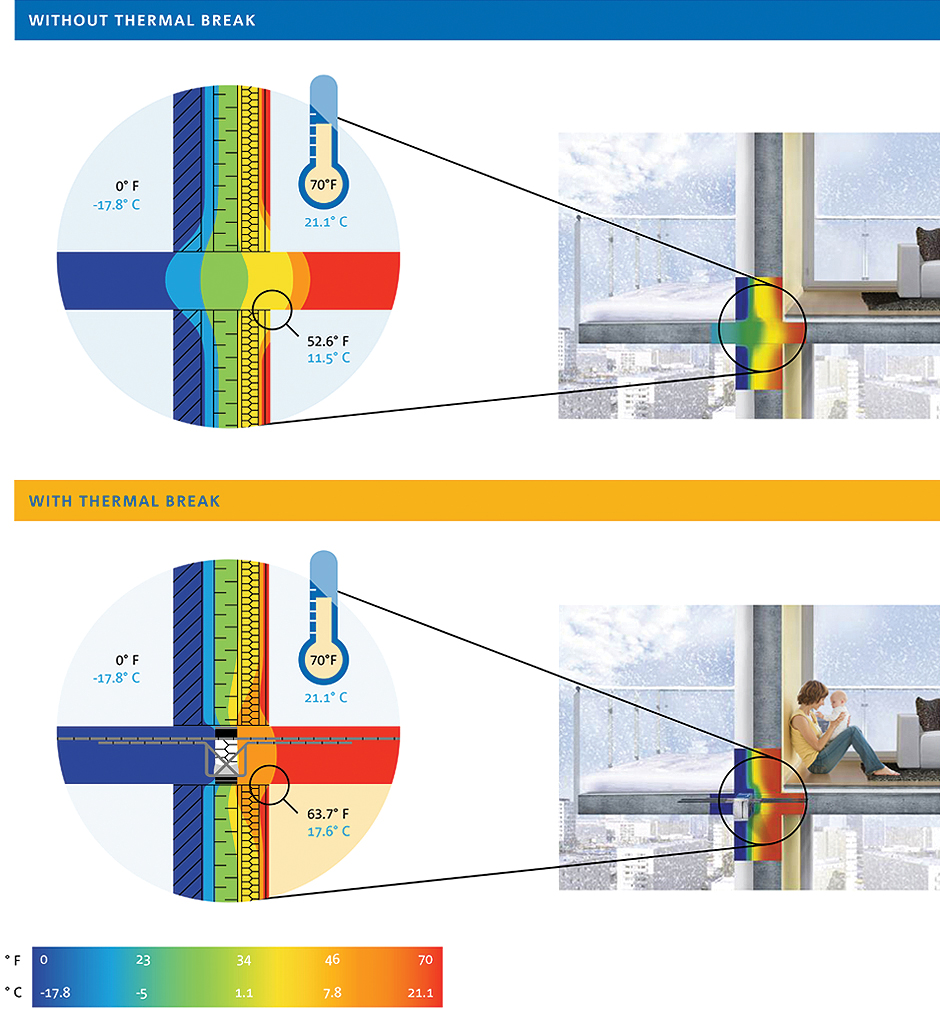
In addition to increased insulation values, appropriate attention to thermal bridging and the incorporation of thermal breaks are becoming important considerations. The objective is to eliminate or minimize all direct connections for heat transfer between the outside and the inside of the building structure. Although relatively small in area, the number of connection points is high across an entire building, which ultimately degrades the theoretical performance of the building envelope assembly in a big way. Imagine a metal screw or pin that holds the rigid insulation to the metal structure. This point is a direct pathway for the outside temperature to influence the inside temperature, which defeats the whole purpose of applying insulation in the first place. This phenomenon (Figure 3) is inherent in numerous envelope assemblies: metal-framed windows, rigid insulation applied to metal stud, and concrete structures where floors and walls meet (to name a few). The challenge with these thermal pathways is that they de-rate the U-value of the overall assembly, which requires the application of more (or higher performance) materials/systems to offset this deficiency. In metal stud framing without continuous insulation, the performance of the wall can degrade upwards of 50% from the prescribed insulation R-value due to thermal bridging of the studs passing through the batt insulation. For this reason, the 2016 California code now mandates (i.e. not allowed to circumvent with whole-building energy analysis) rigid insulation on metal-framed 2×6 stud walls. Furthermore, if not addressed appropriately, the impacts of thermal bridging can cause moisture problems within the assembly, which has a multitude of problems (e.g. mold, structural degradation, etc.). Infiltration can be avoided when a tightly sealed continuous insulation layer is applied to walls. To avoid the pitfalls associated with thermal bridging, structural engineers must envision how the envelope and structural assembly come together in a way that maximizes the application of continuous insulation.
This evolution in the building industry requires unprecedented integration and coordination during the design process. All parties need to be engaged early in the project, and decisions cannot be made in a vacuum. Energy modeling from concept through completion is necessary to realize the high-performance expectations of the industry and codes. By asking the questions early on and modeling the energy/cost performance of multiple scenarios, the chances of delivering the product that the client envisions (and codes expect) becomes much more feasible.
The USGBC has named Hassalo on Eighth in Portland, Oregon, as its 2017 LEED Homes Project of the Year. The award seeks to recognize “projects, architects, developers and homebuilders who have demonstrated outstanding leadership and innovation in the residential green building marketplace.”
Glumac teamed with GBD Architects, American Assets Trust, as well as Biohabitats, PLACE, and Puttman Infrastructure Home to bring this project to fruition, and it is now on track for a 2.4 year payback. For a deeper examination on how this project came to be, check out the presentation Glumac gave along with GBD, AAT, and Puttman at Greenbuild 2016.
PASADENA, Calif.–(BUSINESS WIRE)–Oct. 3, 2017– Tetra Tech, Inc. (NASDAQ: TTEK) announced today that it has acquired Glumac, a leader in sustainable infrastructure design. The company has more than 300 employees and incorporates innovative sustainable technologies and solutions into each of its designs, including the design and engineering of Leadership in Energy and Environmental Design (LEED) standard and Net-Zero infrastructure.
“Our clients, now, more than ever, are looking for sustainable solutions to their infrastructure needs,” said Dan Batrack, Tetra Tech’s Chairman and CEO. “With the addition of Glumac, Tetra Tech can offer additional technically differentiated green infrastructure capabilities to our customers that not only conserve resources, but also reduce their operating costs.”
“We are very excited to join Tetra Tech,” said Steven Straus, Glumac’s President. “Tetra Tech complements our current services while offering more in-depth engineering capabilities and broader access to customers in new geographies. We look forward to continuing to provide our combined client base with industry-leading technical solutions.”

ABOUT GLUMAC
Glumac specializes in cost-effective, sustainable design for all types of projects worldwide including sustainable design, building engineering, and energy analysis.
ABOUT TETRA TECH (www.tetratech.com)
Tetra Tech is a leading provider of consulting and engineering services differentiated by Leading with Science® in providing innovative technical solutions to our clients. We support global commercial and government clients focused on water, environment, infrastructure, resource management, energy, and international development. With 16,000 associates worldwide, Tetra Tech provides clear solutions to complex problems. For more information about Tetra Tech, please visit tetratech.com, follow on Twitter (@TetraTech), or like on Facebook.
Any statements made in this release that are not based on historical fact are forward-looking statements. Any forward-looking statements made in this release represent management’s best judgment as to what may occur in the future. However, Tetra Tech’s actual outcome and results are not guaranteed and are subject to certain risks, uncertainties and assumptions (“Future Factors”), and may differ materially from what is expressed. For a description of Future Factors that could cause actual results to differ materially from such forward-looking statements, see the discussion under the section “Risk Factors” included in the Company’s Form 10-K and 10-Q filings with the Securities and Exchange Commission.
It’s an idea that’s drilled into most our heads as children in one form or another: clean your room, put your toys away, when you leave a place be sure it’s as clean as you found it. Basically – be responsible for your actions, and close the loop on them. It would seem obvious that this lesson would translate into our professional lives, particularly for those of us who work in the built environment. Designing buildings that take up natural space, sap energy from local grids, and produce an unending amount of waste should come with the basic expectation that they do not add to the issues facing their surrounding environment. But historically, as we all well know, that has rarely been the case.
As resources tighten and the effects on our climate tip-toe toward irreversible, the time is now to begin closing the loop on our buildings, and investing in sustainable building design that reaches net zero energy and water. And it needs to happen not just inside the design room, but in our communities as well.
To see this through, occupant knowledge is critical. If the goal is net zero energy, where a sustainable building is able to give energy back to the grid, end users need an immediate understanding of how their actions – large and small – affect the building as a whole. Think of it this way – if a person’s goal is to lose weight, information provided by the nutrition facts on their food’s packaging can help inform decisions that lead to the achievement of that goal. Likewise, if the goal is net zero energy and an occupant has a dashboard that lets them know when plug loads are too high, they are able to take action and, say, unplug their computers at night. Or if the HVAC energy is too high, they can keep their windows open more.
And just like the nutrition facts form, the only way to be sure our decisions are properly informed is to be presented with honest information. Performance metrics can be harsh, but in order for improvements to be made, occupants must know if and when they are part of the problem – or the solution. This is all part of taking this crucial conversation out of the design room, and empowering people who need this knowledge the most – the end user.
New technologies and systems are continually being developed and adopted as part of sustainable building design. However, more efficient buildings that include aggressive energy reduction measures, renewable energy systems, as well as water efficiency and reuse strategies, cannot make the meaningful change needed by themselves. People must adopt habits that incorporate these instruments and make their use the norm in their lives. The disconnect between the occupants and buildings is the key reason that most buildings perform significantly below their modeled design. It is therefore critical that designers look beyond the building and take on the responsibility to affect change among people. To this end, architectural firm Arch|Nexus has partnered with Sustain3 to develop a platform that inspires, educates, influences and rewards behavior that is more congruent with the regenerative goals of the Living Building Challenge.
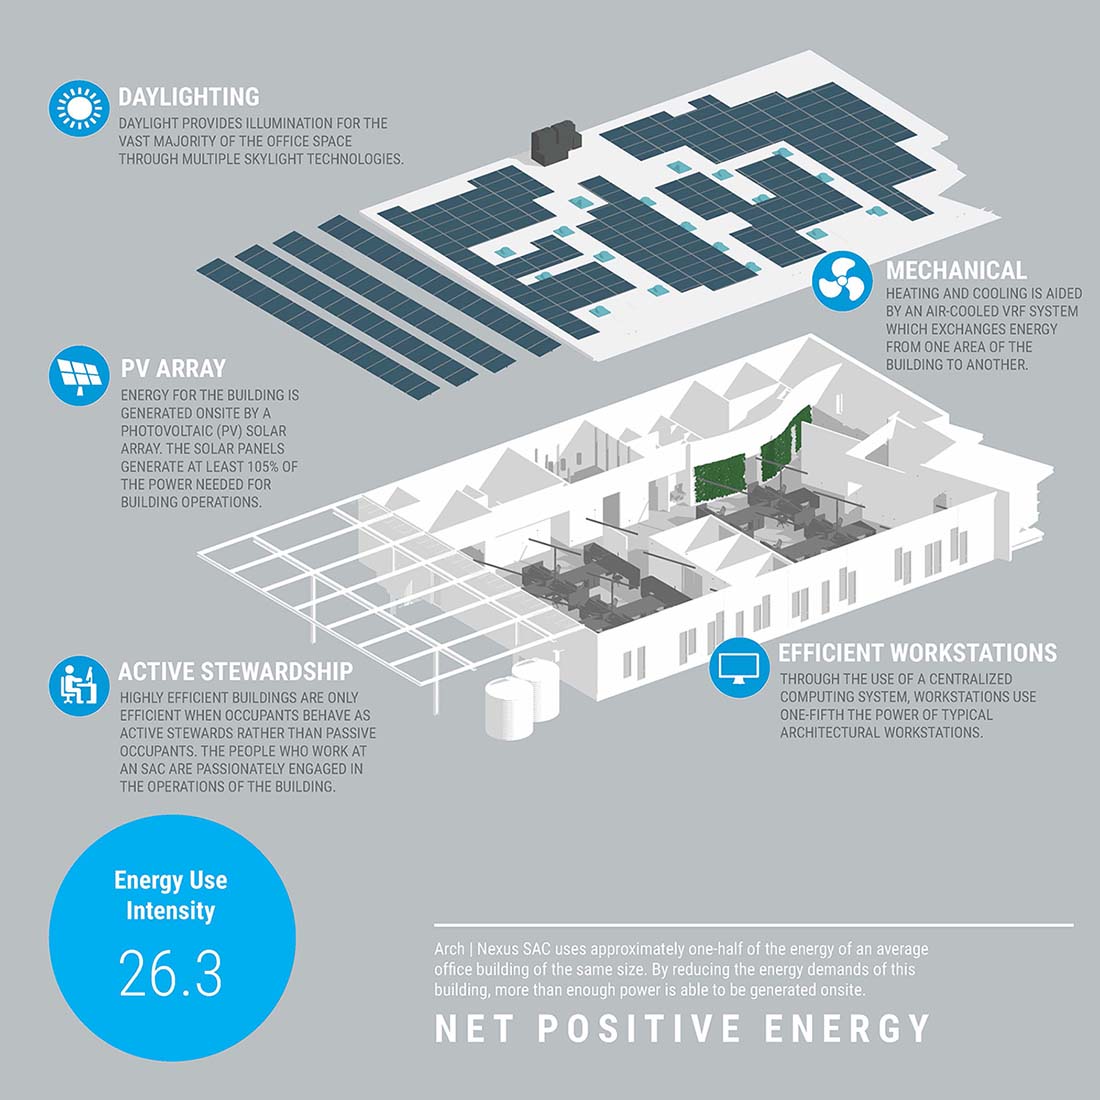
The goal was to create a virtual interface where usage metrics are cataloged and space is given for occupants to share their thoughts on the building’s performance. This creates an effective feedback loop that motivates occupant action. When buy-in is happening at that level, the returns can be tremendous. Peer-to-peer interaction is a crucial component to behavior change. So when occupants see their neighbors engaging with their building in this way, they’ll likely be more inclined to make positive changes in their own habits as well.
The fact that we’re even having this conversation is a huge step in the right direction. A big part of the net zero energy and net zero water movement is honestly confronting the challenges of building design and providing innovative solutions. Cleaning up our mess and continuing to pick up after ourselves. But the A/E/C industry cannot do it alone. It’s a message we must take outside our industry and into our communities – to develop a true demand for these types of projects. And making this a movement that is as sustainable as the buildings we continue to develop.
Arch|Nexus SAC Project Team
We’ve discussed the benefits of biophilic design in this space on several occasions. It is the practice of integrating nature into the built environment. But one question that lingers is – why does it seem so new? People tend to enjoy opening a window, taking in a view, and observing nature-based patterns. For this reason, designers have long respected these types of building measures as good design. Is it that we have lost touch with the natural world, so the conscious understanding of why these elements bring business value, and the idea of further integrating nature into design, seems innovative?
This is where I think the answer lies. People spend more time in buildings than ever before, and for the first time, occupants are being confronted with the deficiencies of their workplaces. It’s causing a loss of business productivity and employee retention. So we need new methods and approaches to create connections with nature that go beyond typical strategies. If our urbanized, technology-strapped lifestyles simply don’t allow people to spend enough time outdoors, we need to do a better job of bringing nature indoors. As Florence Williams authored in her recent (excellent) book, people need their Nature Fix.
OK, so why does this matter? Well, as more than 100 buildings, cognitive science, and medical studies have demonstrated, connections with nature is a human health imperative. It seems too distant a notion for my fellow urbanites, but humans evolved outdoors, and our bodies still rely on nature to function at its best.
For example, our bodies cue into the changing color of daylight throughout the day to determine digestion rates, healing times, and energy levels. Our response to plants, animals and natural patterns is one of vitality, energy, growth, creating a feedback loop that improves our mental state. Nature is also one of the best ways to experience all five of our sense at work. A multi-sensory experience excites brain activity that improves cognition.
Let’s face it. Getting our nature fix is like a good cup of coffee. It’s a daily jolt that our bodies simply can’t function as well without.
Submissions are currently being accepted for the Stephen R. Kellert Biophilic Design Award. The award is offered this year for the first time through the International Living Future Institute’s Biophilic Design Initiative. Selected projects will be recognized globally as leaders through the International Living Future Institute’s global network and will receive substantial recognition with its media partners such as Green Building & Design. Projects submitted must be built and occupied.
I welcome you to submit a project or tell your networks about the award. We need to share more case examples of biophilic design to learn from, so that we can create the very best places for people.
Our Southern California team finished up another great year participating in the ACE Mentorship Program. Staff from our Los Angeles office worked with students from Franklin High School in Highland Park, CA, to design a model high-rise tower as part of a team that also featured ACCO, Johnson Fain, Morley Builders, LA City BOE, Swinerton, Beuhler & Beuhler Engineering, Nabih Youssef, and Standard Vision. Click through to see pictures and a video of the end of year event!
In the past two decades our industry has seen a significant shift toward a focus on energy efficiency and sustainability. In order to properly gauge whether this shift has had a quantifiable impact, terms such as Energy Use Intensity (EUI), Power Use Effectiveness (PUE), and Gallons/Day have become commonplace. These simplified metrics are useful tools in tracking the performance of a building, but they have limits. For example, an airport may be a hub for popular airlines and see higher traffic than a similarly-sized airport on the other side of the city. The resulting higher energy use per square foot would be a mark of failure rather than a success of building performance. But that’s not accurate. To be truly efficient, we need to rethink our metrics, not to shift the goal posts, but to more accurately measure performance.
In both new construction projects and existing building operation, Energy Use Intensity (EUI) and Power Usage Effectiveness (PUE) for data centers are used as benchmarks, and performance goals are determined in terms of an improvement from that benchmark. EUI has in many ways become the miles per gallon (MPG) rating of the building industry. And like MPG, EUI has its limitations. It is commonly understood that a vehicle rated at 25 MPG is quite efficient if that vehicle is a pickup truck, but not exceptionally efficient if it was a subcompact sedan. Similarly, a hospital with an EUI of 120 kBtu/ft2/year could be considered quite efficient, but an office with an EUI of 120 likely has significant operational and equipment deficiencies. It’s not a simple apples to apples measurement.
EUI can be a valuable metric when comparing performance of similar buildings, or used as a starting point in energy analysis, but it may not tell the full efficiency story. Moreover, energy costs are a relatively small component of the bottom line for a business. In fact, in a typical Los Angeles office space, annual employee compensation is approximately $300/ft2 and rent is roughly $36/ft2/year, while energy costs are about $1-2/ft2. That said, these three figures are interrelated, and investments in energy efficiency can improve a business’ bottom line if they result in increased employee productivity. With that in mind, what if we started using employee productivity as a building performance metric?
“A performance metric that considers a true measure of the building’s success as it relates to its core purpose is more appropriate.”
To get a better sense of what this might look like in a real-world application, let’s compare two competing retail stores of similar size and type in the same geographical area. Store A sees twice the revenue as Store B, so as a result of its success, Store A is open for business 80 hours a week versus 60 hours for Store B. Assuming the shells of both buildings are insulated to the same levels, and lighting and HVAC systems operate at similar efficiencies, one would expect Store A to have an EUI at least 30-40% higher than Store B. Does this mean that Store B has a more energy-efficient facility? Probably not. Does Store B have a smaller environmental impact than Store A? If you consider the fact that Store B may have more unsold food waste than Store A, then likely no. Is Store B more successful at achieving its core purpose than Store A. Definitively, no.
In this example, a performance metric that considers a true measure of the building’s success as it relates to its core purpose is more appropriate. Therefore, normalizing energy use by number of customers served, number of cash register transactions, annual operating hours or pounds of food sold may be more indicative of efficiency than EUI.
Let’s explore the use of such “advanced metrics” to establish more appropriate benchmarking targets and for more meaningful comparisons between buildings during design and in operation. By selecting more appropriate metrics, building design teams and energy managers can improve understanding of true building performance, environmental impact and identify areas of improvement. ENERGYSTAR Portfolio Manager does this to some degree, asking high-level questions such as number of hours in operation per week for a building and number of computers within a space, for example. And yet, instead of focusing on targeting ENERGYSTAR scores our industry still focuses on EUI.
Importance of Performance Metrics
Performance metrics are vital in determining how efficiently or effectively a facility is operating, or is designed to operate. By compiling measured energy, water, and waste effluent data into databases such as ENERGYSTAR Portfolio Manager, benchmarks can be established for various building types and buildings in different climates. Benchmarks are then used as starting points in designing new facilities or investigating energy cost savings opportunities in existing buildings.
Building energy codes in many jurisdictions in the U.S. are beginning to put requirements in place that mandate building automation systems (BAS) capable of logging data. Some U.S. cities and states require benchmarking and disclosure of energy data. [1] When performance monitoring becomes standard, energy codes may then start to require energy efficiency targets be verified in operation. When this is the case, traditional metrics like EUI may not be appropriate for every building type. Advanced metrics for different building types will provide a realistic means of achieving these energy targets.
Airports
While energy costs can represent a small fraction of total operating costs for a tenant in an office building, they are typically the second highest cost after employee compensation for airports. [2] This puts pressure on airport energy managers and facilities managers to assess, monitor, and continuously improve energy efficiency. The challenge is that industry-standard benchmarks are not well established.
As with the retail store example above, EUI has its shortcomings in relation to airports. A Texas A&M University study found that EUI varies widely between airports of different sizes (floor area, ft2), with small airports having the highest average energy costs per square foot, followed by large airports. Medium-sized airports tend to have the lowest energy costs per square foot. [2] Because of this, EUI may not provide a meaningful benchmark for a facility. Therefore, it is difficult to determine potential energy cost savings and find energy end-uses to focus on.
For more details on our airport experience, head over to our project portfolio at glumac.com
When normalizing energy use by Traffic Units, however, a pattern begins to emerge. A Traffic Unit (TU) is defined as a passenger enplanement or deplanement, or 100 kg of cargo incoming or outgoing. FIGURE 1 below shows the annual kBtu/TU value for the most part falls within 10 and 40, with a few outliers. Only the smallest airports have kBtu/TU values much higher. [3]
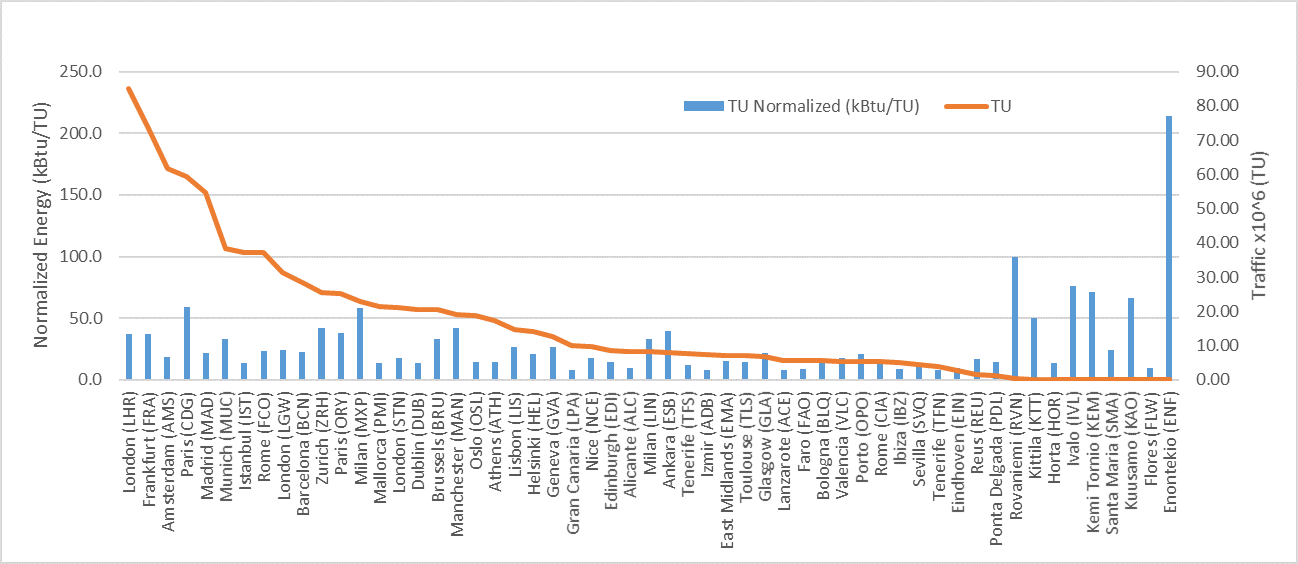
Figure 1. Annual energy consumption of select European airports, normalized by Traffic Units (TU). For 2009-2010 (Source: Salamone)
Traffic Unit (TU) energy values provide a more meaningful representation of how efficiently an airport operates since it considers how much passenger and cargo traffic the facility handles. Annual TU can be thought of as a measure of productivity for an airport, just as throughput captures productivity in the manufacturing industry and revenue for an office space. But whereas a linear relationship between floor area and production capacity can be assumed in a manufacturing plant or an office building, airports vary widely in layouts and space functions so the relationship is not as firm.
Comparing London Heathrow and Amsterdam Schiphol airports exemplifies the appropriateness of normalizing energy use by TU rather than floor area. FIGURE 2 below shows a comparison of EUI and TU-normalized energy use for the two airports for 2009-2010. The EUIs are both approximately 150 kBtu/ft2/year, with Amsterdam Schiphol slightly higher. But London Heathrow has a significantly higher kBtu/TU value than Amsterdam. Were an energy manager at either airport to use EUI to benchmark their facility’s energy use, they may assume that their facility’s efficiency is in line with a comparably-sized European airport. But the discrepancy between the two airports indicates that inefficiencies exist in London Heathrow’s operations.
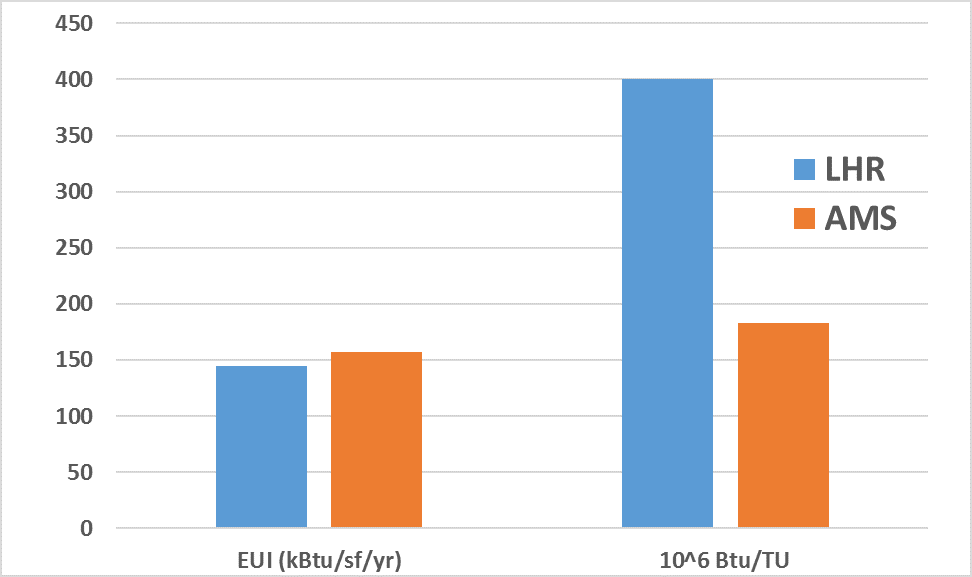
Figure 3 below helps explain the discrepancy shown in FIGURE 2. While the airports handle a similar amount of traffic, the floor area of London’s buildings is more than three times that of Amsterdam’s airport.
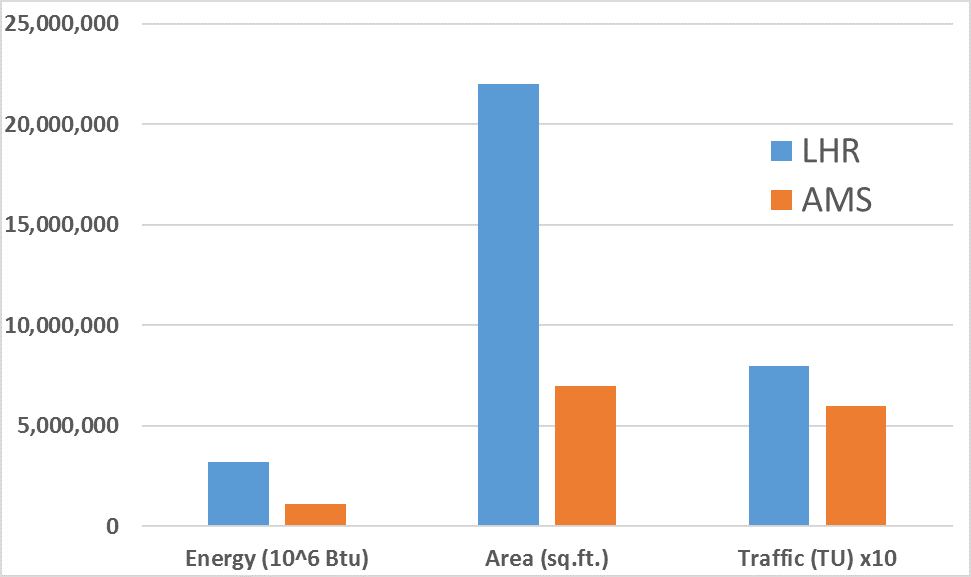
The significant discrepancy in floor area indicates that the building layout of Amsterdam Schiphol is more space-efficient than London Heathrow. This translates to higher energy efficiency for Amsterdam Schiphol. Comparing the terminal layouts of the two airports, as shown in FIGURE 4 and FIGURE 5 below, it is clear that the model of a single terminal with gates radiating off a central model that Amsterdam Schiphol employs is more efficient that the distributed terminal model seen at London Heathrow.


This example illustrates how energy use does not show strong linear correlation with floor area in airports. The difference in layouts between the London and Amsterdam airports exemplifies this. In addition to space efficiency, other factors not present in other building types drive energy use in airport facilities.
Space efficiency can optimize energy use involved with transporting passengers and cargo from one area of the airport to another, but it can also allow for demand-based building systems (mechanical, electrical, plumbing, low-voltage, etc.). By strategically planning programmatic areas of the facility to group spaces with similar operational schedules close to each other, lighting, HVAC and other systems serving large portions of the airport can be shut down when not in use. By providing this system isolation with demand-based operational control (by using occupancy sensors, time clocks or some other method) significant energy savings can be achieved without compromising operations, security, safety or the occupant experience.
Another factor related to energy use is air quality management. With most airports being surrounded by or in direct proximity to runways, air handling units need to provide proper filtration to prevent aircraft and other vehicle exhaust from entering occupied zones. This added filtration increases pressure drop to forced-air duct systems, which drives up fan energy use. Using low pressure drop filters, such as absorber or carbon filters, can help mitigate this issue, but strategic placement of buildings and outside air intakes could potentially provide more benefit.
Carbon Footprint
When considering energy efficiency, infrastructure and O&M upgrades at a facility, oftentimes only site energy end-uses are considered. This is because energy costs can be controlled within the site boundary to a certain degree. But the environmental impact of any facility extends beyond the site boundaries. Carbon footprint, a common metric for total environmental impact, incorporates all energy consuming activity related to the facility, both on- and off-site.
Greenhouse Gas Protocol, a widely accepted set of standards that provides guidance for accounting of greenhouse gas emissions, has established three Scope boundaries for categorizing emissions. Scope 1 consists of any direct emissions from energy using systems within the site boundary. This includes emissions from equipment – things like gas boilers, cogeneration plants, and fossil-fuel vehicles. Scope 2 includes greenhouse gas emissions from energy sources used on site, including off-site electric power and district heating and cooling. Scope 3 encompasses indirect emissions associated with activities that support operation of the facility. Examples of these activities include vehicle emissions from suppliers transporting goods to the site, and waste disposal trucks hauling refuse away from the site. Scope 3 also can take into account emissions caused by customers’ actions related to the facility.
Scope 2 and Scope 3 emissions are more difficult to calculate than Scope 1 emissions, but they represent meaningful portions of the environmental impact of a facility and, moreover, an organization. If an organization places emphasis on reducing its carbon footprint and environmental impact, it should utilize benchmark metrics that take into account Scope 2 and Scope 3 emissions, in addition to site emissions.
Energy management of Scope 2 emissions involves analyzing electricity and thermal energy utilities. In states with deregulated utilities, several independent power producers may be available to purchase wholesale electricity from. These may vary in power sources, and some may have a higher mix of renewable and clean power. Also, the organization can consider purchasing Renewable Energy Credits (RECs) to offset their greenhouse gas emissions.
Reducing the environmental impact of Scope 3 involves “greening” of the supply chain. This can entail finding suppliers who hold sustainability in high regard and continuously monitor and work to improve their own environmental impact. Or it can involve working with existing suppliers and providing suggestions for improving the efficiency of their operations. Operational decisions within the facility can reduce the carbon footprint of suppliers, tenants, and customers as well.
While making capital investments to reduce the carbon footprint associated with Scope 2 and Scope 3 emissions may not have a quick return, revenue can be generated indirectly. If an investment is made in reducing suppliers’ energy use and costs, they could pass some of the savings on to the facility’s organization. Such investments in to greening the supply chain, as well as investments into green power, can also drive revenue as consumers are increasingly looking for organizations to demonstrate a commitment to the environment and to corporate social responsibility.
Just as accounting for Scope 3 carbon emissions is a difficult task, so too is determining appropriate performance metrics. Simply tracking kg of carbon emissions of the supply chain may be sufficient. But creativity on the part of the energy, operations, or sustainability manager may produce advanced metrics much more suitable for certain situations.
While industry standard performance metrics such as EUI and PUE can provide insight into the energy efficiency of many building types, certain facilities can benefit from the use of advanced metrics. Such metrics should incorporate a measure of the core purpose or goal of the facility, or describe the performance of a key system or component that was a point of emphasis in design or is a major focus of an existing building efficiency project. Project teams are encouraged to create their own metrics as appropriate to accurately determine whether a design goal is achieved in operation. Using an industry-established advanced metric such as TU-normalized energy use in airports, however, allows for comparison with existing facilities.
After a phase starting in the early 2000s that saw the building industry worldwide focus on designing energy efficient buildings, the trend is shifting to actual building operation and verifying energy performance. To make best use of the data collected from buildings, databases like ENERGYSTAR Portfolio Manager can be used to monitor building efficiency changes over time, and for comparing efficiency of similar buildings. If appropriate data is included for different building types, strong benchmarks can be established for advanced metrics. With more data points available, the data-set becomes richer and benchmarks become more meaningful. Currently, many advanced metrics must be calculated with data ascertained through case studies. With a limited number of comparison points, it is difficult to determine the relative performance of one building to all buildings of its type. But as databases grow, benchmarks get more meaningful, allowing for more informed design decisions and energy efficiency investments.
*Originally Published for the AEE West Coast Congress
References
[1] Map: U.S. Building Benchmarking and Transparency Policies. Institute for Market Transformation. Online. [http://www.imt.org/resources/detail/map-u.s.-building-benchmarking-policies]. Accessed April 7, 2017.
[2] Salamone, Michael R. 2007. “Research Results Digest 2: Model for Improving Energy Use in U.S. Airports” (p. 1). Airport Cooperative Research Program, Sponsored by the Federal Aviation Administration. Transportation Research Board of the National Academies.
[3] Costa, Andrea; Blanes, Luis M.; Donnelly, Ciara; Keane, Marcus M. 2012. Review of EU airport energy interests and priorities with respect to ICT, energy efficiency and enhanced building operation (pp. 4-8). Proceedings of the Twelfth International Conference for Enhanced Building Operations. Manchester, UK: European Community’s Seventh Framework Programme.
[4] Bui, Ann. 2013. “50 Largest Cities Water/Wastewater Rate Survey.” (p. 17). Black & Veatch Management Consulting. [http://www.saws.org/who_we_are/community/RAC/docs/2014/50-largest-cities-brochure-water-wastewater-rate-survey.pdf]
Mixed-use facilities require engineers to handle several complex components. Our own Scott Vollmoeller recently joined CSE Magazine for a roundtable conversation with other mixed-use facility experts for a discussion on how to successfully execute these large-scale projects.
Head over to CSEMag.com website for the full discussion.
Glumac’s Kameron Beeks, PE, LEED AP BD+C, WELL AP, and Sarah Deunay worked with seventh graders in downtown Los Angeles to demonstrate natural water filtering systems that contribute to sustainable building design. The lab experiment, developed by Deunay, was part of a partnership with the Architecture Mentorship Program at Para Los Ninos Charter school – an initiative designed to give students hands-on experience with various aspects of building design and construction.
“The lab activity was to create a homemade water filter using various compositions like sand, gravel, cotton, and so on,” Beeks said. “And we created dirty water using things like coffee, hot chocolate powder, toothpaste – things you’d find around the house.”
Natural filtration systems are a significant design strategy in sustainable mechanical, electrical, and plumbing design. To see a real-life implementation of what the Para Los Ninos students, click here to read how our engineers helped integrate a natural filtration system at Hassalo on Eighth in Portland, Oregon.
The initiative is part of Glumac’s ongoing effort to create youthful interest in the STEM fields.
We’d love to visit your school too! If you’d like a Glumac engineer to speak to students in your area, email us at [email protected].

The demand on our electrical grid is increasing by the day. As cities continue to grow upward and out, all aspects of our daily life – from leisurely browsing the Internet on a smart phone to necessities such as heating and light – are all tied in. This makes a resilient approach to the electrical design of our office buildings, healthcare facilities, schools, and homes crucial.
Electrical commissioning plays an important role here. To create modern facilities and spaces that are up to the challenge of quickly ballooning electrical loads, we need to be certain their electrical designs and operation are correct upon installation, and that they are prepared to scale up as the building grows into its maximum capacity. This is a conversation that’s common around data centers and other mission critical facilities. But buildings are much more complex than they used to be. Sustainable building design makes everything mission critical, and the need for electrical commissioning services that ensure efficient designs are installed is growing. It’s the only way to be sure a facility is sustainable, resilient to unforeseen circumstances, and fully operational throughout its lifespan.

Systems with defects become less forgiving as time goes by. As they age, the load on the system increases, and poorly installed parts start showing signs of overheating and shorting. Take, for example, a building that is designed with a 1000-amp electrical distribution system. Hundreds of parts, panels and cables are ordered and shipped to the job site and then they get cut, crimped and assembled by the installing contractor. On day-one the building may only be operating at 350 amps. Maybe the building is a third full and its major commercial tenant has not fully taken over its space. But, as more occupants move in, new equipment is installed, and new technologies are developed and implemented, the amp usage might soon increase to 850 amps. As the system load approaches 80 percent or more, any defects in the electrical system start to cause problems and performance deficiencies will become much more apparent. Sustainable technologies fail, energy efficiencies float out the window, and tenants begin overcompensating in ways that turn a building’s safe and reliable electrical design into a messy, unreliable and – even worse – unsafe system.
So what could go wrong at installation? As an owner, architect or engineer, you may be surprised:
WHAT CAN GO WRONG UPON ENERGIZATION
- Transformers are wired backward, making a step down transformer a step up or vice versa.
- Motors are improperly wired and run backward.
- Controller settings are not properly set causing unsafe environments.
- Phase rotation is not thoroughly verified.
- Tests as required by design are not properly implemented. Any of these could cause serious safety issues or equipment damage.
WHAT CAN GO WRONG OVER TIME
- Connections are not tied or not made at all.
- Cables with defective insulation are installed, which under additional load can start heating and cause unsafe conditions.
- Missing or improper grounding.
- Too many wires in a conduit, which can cause overheating at higher loads.
- Wrong size cables won’t show any overheating effects until they are loaded to near full rating.
- In the case of earthquakes, electrical equipment that is not properly anchored can fall and cause serious problem.
We acknowledge that in an office building the failure conditions do not cause the same immediate disruptions as they would do in a data center. But at the same time the root cause of problems – the rush of a project leading to improper installation and /or lack of attention to details – is the same. If you are spending thousands of dollars to design and install wiring and an electrical infrastructure – it’s critical to ensure it’s installed correctly and will operate safely over the life span of the building.
Early involvement of an electrical commissioning authority is strongly recommended to allow for review of design documents in addition to making sure that certain test requirements are included in contract documents. It is always easier and more cost-effective to fix issues during the design phase rather than after installation.
Efficient electrical design directly contributes to resiliency and sustainability. With a commissioning team providing extra care and oversight at the start of a project, investments in sustainable and resilient systems will pay off down the line.
To learn more about our electrical commissioning services, visit cx.glumac.com or reach out at [email protected].
New York, New York (February 15, 2017) – Delos™, a wellness real estate and technology firm, today announces a strategic alliance with Glumac, a full-service consulting and engineering firm, to accelerate the transformation of indoor environments into spaces that promote human health and wellness. The new relationship will leverage Glumac’s extensive network of sustainable building services clients to further expand the global reach of the WELL Building Standard™ (WELL), which is the world’s first building standard focused exclusively on the effects of the built environment on human health and well-being.
![]()
Glumac’s partnership will work to grow its staff of WELL Accredited Professionals (WELL APs) and participate in the WELL Living Lab. A known leader in the sustainable design space with 100 LEED APs and ten Living Building Ambassadors, Glumac has been at the forefront of the healthy building movement, with nine projects registered to pursue WELL Certification. As part of the alliance, Glumac will build upon this commitment to WELL and will professionally accredit 20 of its employees through the WELL Accredited Professional (WELL AP™) program, which signifies advanced knowledge in human health and wellness in the built environment and specialization in WELL. Glumac professionals will be well equipped to provide clients with tools to realize the benefits of WELL and guide current and future projects toward WELL Certification.
“Glumac is a globally recognized engineering and consulting firm that is often looked to as a leader in sustainable design, and we are thrilled about the potential of our alliance to further propel the adoption of healthy buildings and indoor spaces.”
– Paul Scialla, Delos Founder & CEO
“Since its inception, Glumac has focused on building performance as a means to enhance human performance. By advancing the WELL Building Standard in the projects that it undertakes and making sure its team members become WELL APs, the company underscores its leadership, and we’re looking forward to its support.”
– Rick Fedrizzi, Chairman & CEO of the International WELL Building Institute™
“Glumac looks forward to collaborating with Delos to provide the healthiest indoor environments possible. Our work in MEP engineering, energy modeling, and building commissioning has a direct effect on the health, well-being, and productivity of the people who live and work in the projects we design. Setting an international standard will allow our clients to know, they have best in class spaces.”
– Steve Straus, CEO and President of Glumac
“We are thrilled to partner with Delos to more fully deliver healthy buildings to our clients. That is our mission. It is critical that clean air, water, abundant natural daylight and connections with the outdoor world are integrated into indoor spaces, given the impact on our general health and productivity. This medical evidence will help the industry understand that when designed well, the benefits of green building technologies to human health and return on investment go hand in hand.”
– Nicole Isle, Glumac Chief Sustainability Strategist
Visit Delos‘ website for more information about Glumac’s partnership and the International WELL Building Institute.
“Green building” became a buzzword in the A/E/C industry about 15 years ago, and since then design conversations have mainly focused on performance. Improvements to occupant wellness was simply assumed as a side benefit. After all, a healthy planet can better support the health of growing populations. Sounds like a win-win. But as we prioritized design solutions to, for example, reduce carbon or water use we neglected to truly assess the impacts the built environment has on human health. Fast forward to 2017, and we still don’t quite understand what the health effects of our green buildings are on occupants, and struggle to answer to a consumer population that has become way more savvy about making healthy choices. Material toxicity, air quality, water quality, fitness, and nutrition – consumers are more educated that ever before (and rightly so!) and as urbanization continues. And as people spend more time indoors than ever before, we need to know what it takes to deliver the most efficient and healthy buildings possible.
Thankfully, organizations like the International WELL Building Institute (IWBI) have stepped forward and provided the WELL Building Standard, a building standard that offers owners and project teams design solutions meant to provide a direct benefit to human health and well-being. The standard also shines a needed spotlight on lighting quality and acoustics – two design areas that have traditionally played a lesser role in green building, but are actually paramount to our health and productivity.
When we closely consider the business aspect of this approach, we see healthy buildings are also known to increase business profits. After all, people are generally a business’s most expensive asset (unless, of course, the business is a warehouse or data center). Let’s take an office building as an example. Employee benefits and salaries typically comprise 90-percent of business operating expenses, while rent and utilities comprise a mere 10-percent. (US Department of Labor 2010; BOMA 2010). Financial losses quickly add up when employees are unproductive, stressed out, or become ill due to poor indoor conditions, such as CO2 levels, chemical off-gassing, poor temperature, and bad acoustics. And those losses can quickly offset gains achieved through energy-efficient design. In other words, an efficient lighting upgrade with a 2-year payback, will actually lose money if glare, eyestrain, or poor light levels jeopardize even 1-percent of employee productivity.
Numerous studies have shown the economic benefit from healthy buildings. Whether it’s higher retail sales, employee productivity, student learning rates, or hospital patient healing times, for example (Terrapin Bright Green 2014, COGFX Study), the business case is clear: a building investment on environmental performance and performance of occupants can yield greater and more sustainable ROI. The WELL Building Standard has been developed to help provide a road map to successfully deliver healthy buildings.
WELL BUILDING STANDARD
The WELL Building Standard is an independently verified, performance-based system for measuring, certifying and monitoring features of the built environment that impact human health and well-being. Delos, a real estate company based in New York pioneered the standard after spending seven years undergoing rigorous research and review with leading authorities in the medical field, namely the Mayo Clinic and Cleveland Clinic, as well as green building leaders including the USGBC and the International Living Future Institute. Delos formed IWBI to administer the program and they partner with the Green Business Certification Institute (GBCI) to certify projects (GBCI also certifies LEED buildings).

The WELL Building Standard is defined by seven concepts: Air, Water, Light, Comfort, Food, Fitness, and Mind. Certification goals include Silver, Gold, and Platinum. WELL is part design-based and part performance based and requires an IWBI-appointed WELL Assessor to test health qualities in the building, most notably related to air, water, acoustics, and light, and to visually inspect targeted design measures. Glumac’s engineers, lighting designers, building modeling experts, and commissioning agents take a large role in ensuring post-occupancy performance levels. We work closely with the project owner, architect, acoustic consultant, and contractor to select the most economically agreeable healthy building solutions.
More than 200 projects are already registered with WELL program and more than 20 are certified. Commercial office buildings, interior spaces, multi-family buildings, retail stores, schools, restaurants, and commercial kitchen projects can all become WELL certified. As this is a performance-based standard, it is important to note that re-certification is required every five years (core and shell buildings excluded).
COST OF THE WELL BUILDING STANDARD
We have seen the costs to design and construct WELL buildings decrease since 2014. This is due to an increase in the number of design options available. For example: the standard originally required UV lamps on building cooling systems to inhibit mold and mildew growth – two major contributors to poor indoor air quality. However, a newer option has been established that in certain cases, allows for regular building maintenance inspections lessening upfront costs of expensive UV lamps, not to mention their maintenance and replacement costs.
However, the cost to certify buildings can appear expensive as compared to LEED. Whereas LEED certification is around $0.05 cents per square-foot, WELL certification costs are on average $0.50 per square-foot. This is because WELL certification is hands-on and performance based. Every project is assigned a WELL Assessor, who acts as a go-to wellness design expert for the project team and during construction. The assessor visually inspects every health and wellness measure installed and tests the quality of the air, water, light, and acoustics, producing a report that the owner can use to educate employees and market the building.
However, a more accurate assessment of WELL costs should be based on cost per person and assessed against a business’s typical employee health benefits package. This can get complicated as building costs and people costs are traditionally managed separately, but it would provide a more accurate assessment of WELL costs, as the design benefits and HR benefits are both meant to support employee health and productivity.
THE GLUMAC APPROACH
Glumac plays a prominent role in the WELL certification of the building projects we support. As leaders in sustainable building design, we have deepened our knowledge of biophilic design, and have staff from multiple disciplines achieve WELL AP certification.
Building Modeling: We conduct indoor and outdoor modeling to determine thermal comfort and light conditions, building influences, and envelope performance. Conditioning is crucial to healthy building design, and we can now determine which areas of the envelope are not shielding heat or are leaking cool air.
Mechanical Design: When done correctly, mechanical systems enhance the livability of a space. Indoor air quality is directly related to ventilation effectiveness, thermal comfort design, control systems, and HVAC acoustic dampening. To create a truly occupant-focused space, we address these issues in our mechanical designs.
Lighting Design: When a space’s lighting is designed to work in congruence with the body’s biology, following the same pattern as natural daylight, we can create spaces that enhance an occupant’s health, happiness, and productivity. It’s an approach known as circadian lighting design, and we are finding beneficial implementations across various project types.
Water Design: Water collection and recycling does not need to be done simply for plumbing efficiency. It can contribute to the various components of biophilic design, which goes hand and hand with the WELL approach. Nature-inspired approaches such as green walls and fountains provide visual and sound stimulation that has been shown to reduce stress and improve cognitive function.
Commissioning: System testing and post-occupancy monitoring is crucial for an investment in health-building design to pay off. Our commissioning team can provide the on-going care and expertise to help optimize ROI.
We are committed to integrating healthy building solutions in commercial projects of all sizes. For more information about our projects and the WELL Standard, please contact our Chief Sustainability Strategist, Nicole Isle, at [email protected].
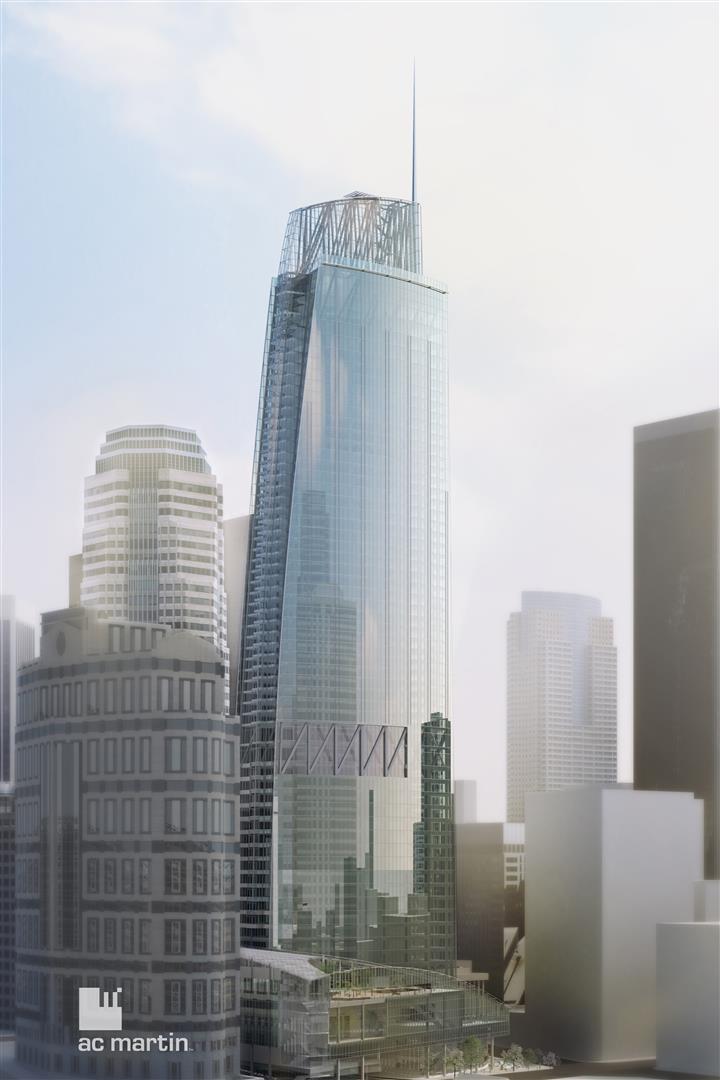
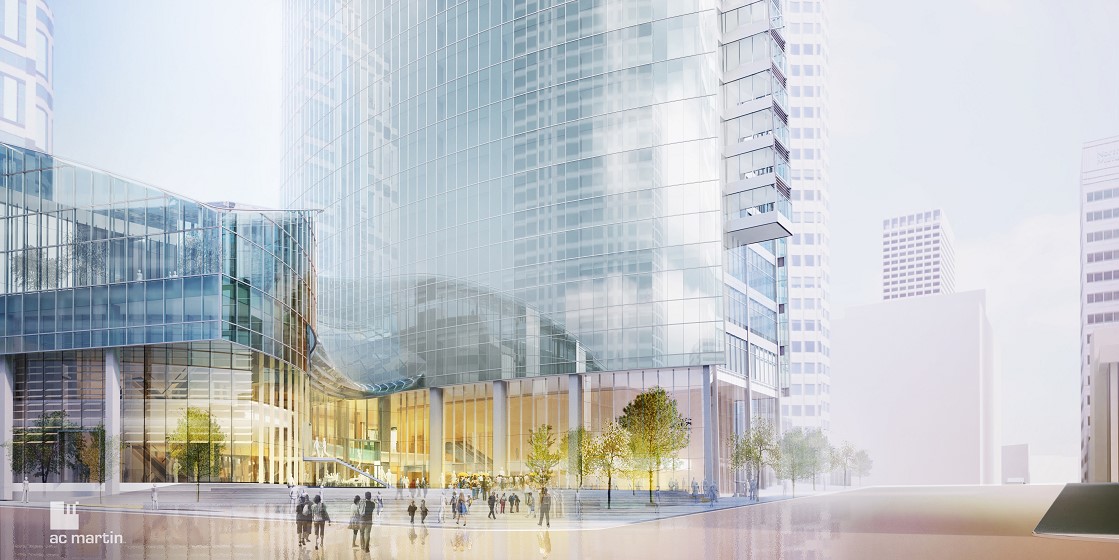
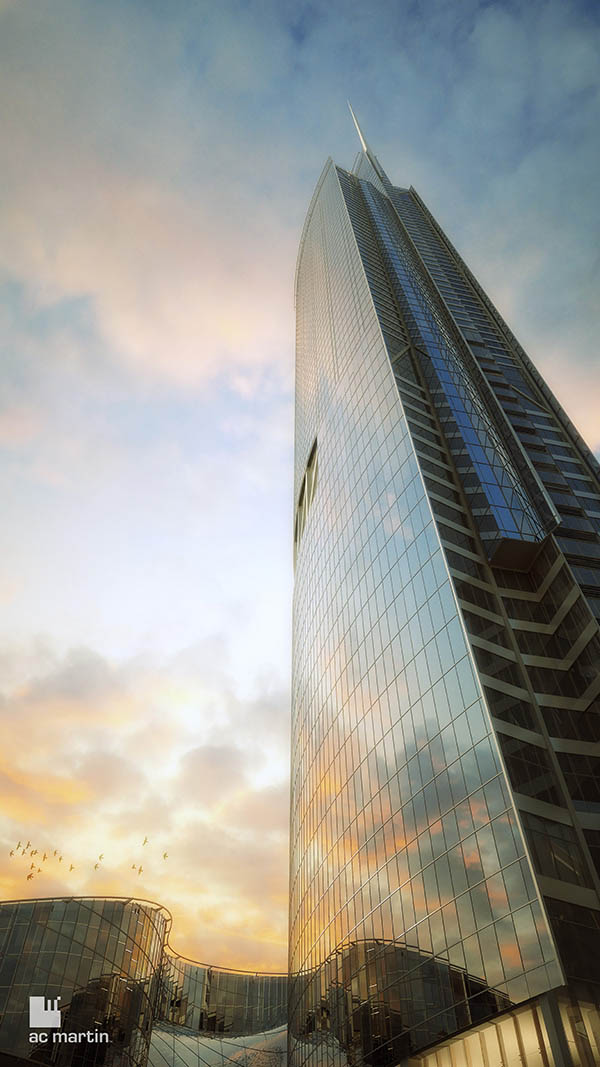
The façade of a building defines both its mark in a landscape and its footprint on the environment. And that’s definitely apparent with the new Wilshire Grand in downtown Los Angeles. Designed by AC Martin, Wilshire Grand Tower is a wholly unique entry into the LA skyline, and has reshaped what a high-rise can look like in Southern California.
Design decisions surrounding the amount of vision glass, glazing specification, window assembly, wall insulation, and shading devices have a significant effect on a building’s overall appearance and performance. With so many variables in play, a collaborative effort between all disciplines is required for a building’s facade to meet both the aesthetic and sustainability goals. The optimal strategy is different for every building depending on the geometry, orientation, location, and occupancy type. When properly designed, the facade can help reduce the energy usage for air conditioning, provide ample natural daylight and create a comfortable environment for all its occupants. In order to find the medium between these parameters for the Wilshire Grand, numerous iterations of the building envelope were analyzed by the team.
The original building envelope concept aimed to provide the best possible view of the Los Angeles landscape for its tenants through maximizing the amount of vision glass. However, there can be a significant downside to maximizing vision glass on the HVAC systems. The original building targeted an 80% window-to-wall ratio (WWR), which was also significantly higher than the Title 24 maximum of 40%. In order to find a balance between building the amount of vision glass and HVAC performance the project team created an energy modeled the building and assessed various WWR options. This helped to establish a WWR of 50% and paved the way towards developing an effective overall energy efficiency strategy for the Wilshire Grand to perform above and beyond California code baseline.
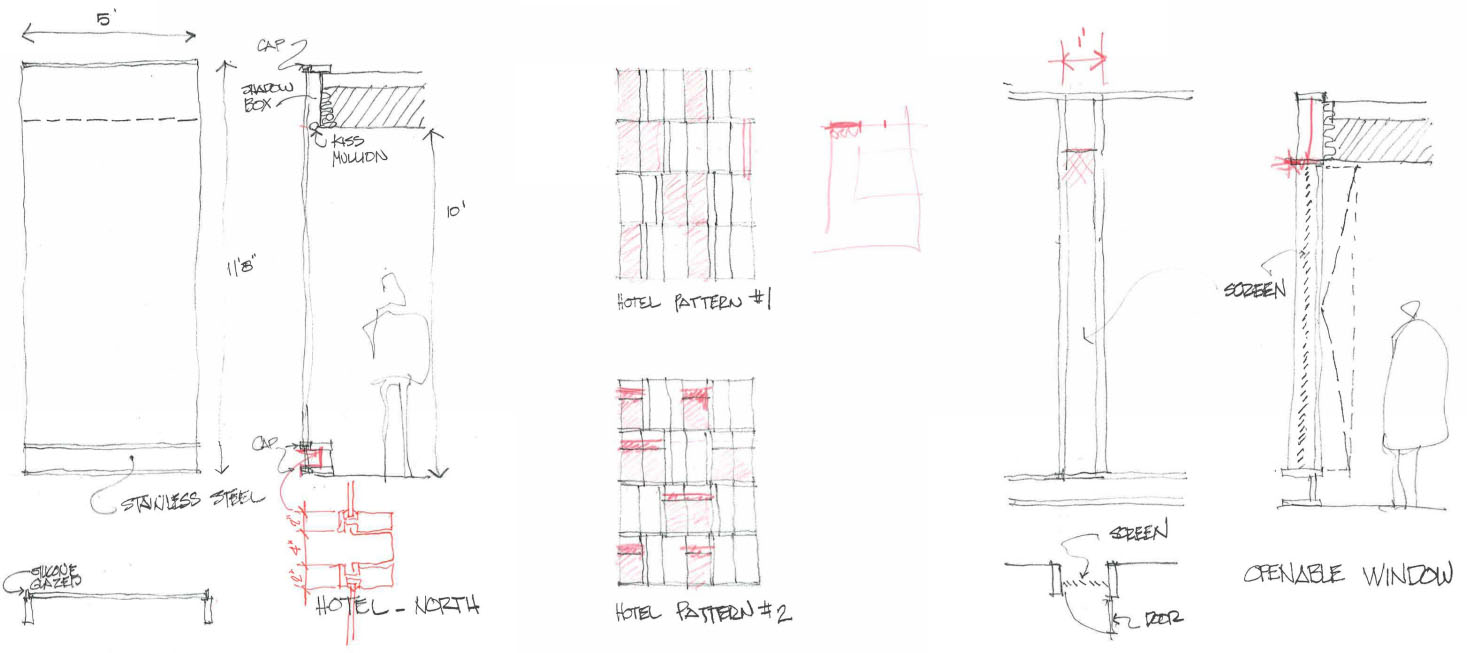
Being in the center of downtown Los Angeles, the team first assessed the site location to determine which parts of the building were shaded at what times in times of the day from neighboring buildings. Based on the shade cast upon the façade by neighboring buildings, a concept was developed for varying the depth of the horizontal and vertical fins along the south façade of the building, thereby maximizing shading potential and minimizing material costs. The envelope study also included the assessment of various glazing specification, insulation values and shading schemes for the Wilshire Grand. This paper aims to serve as a case study for how the design teams can approach the design of facades for tall buildings of the future.
Background of the Wilshire Grand Tower
The Hotel Statler opened in 1952 on the current site of the new Wilshire Grand and became a landmark of downtown Los Angeles during its 50+ year lifespan [1]. The property was purchased in 1989 by Korean Air and in 2012 began demolition of the original hotel in order to make way for what will be the new Wilshire Grand. The new building will top out at 1,099 feet (335 m) and will be the tallest building west of the Mississippi River. As a mixed-use project it will feature retail, commercial office space, restaurant space, nightlife areas and a 900-key hotel. The building had the initial design intent to create an all glass façade that, once finished, would be an iconic and wholly unique addition to the Los Angeles skyline. It was immediately clear that in order for a project of this magnitude to become reality, it would take a group effort. Inter-disciple cooperation between the architects, façade engineers, and the MEP engineering team would be critical to success.
The primary objective of the envelope study was two-fold: first, find the optimal window-to-wall ratio and second, tune the envelope parameters to improve the building’s energy performance. Ultimately, it was desired for the project to both maximize window-to-wall ratio and ensure the building’s facade was extremely energy efficient. It was equally important for the owners and design team maximize view and make as grand an impact as possible on the Los Angeles skyline while maintaining the high sustainability and energy efficiency goals established for the project.
Sustainable Building Design
In order to quantify the effect each design decision had on Wilshire Grand’s envelope performance, Glumac developed multiple iterations of energy models and shading studies throughout the design process. This initially took place in the conceptual phase, where insights to the envelope performance could be most impactful on the façade design. This analysis continued throughout the entire design process with close collaboration between AC Martin and their design consultants. The following section outlines the process used to reach the final façade design for the Wilshire Grand.
Method – Solar Radiation – Site
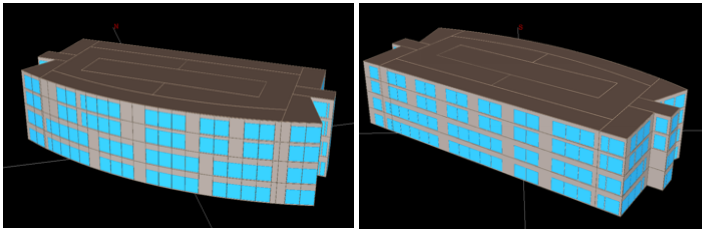
Due to the density of the Financial District in downtown LA, a shading study was imperative to determine how other high-rise buildings in the area would affect the façade of Wilshire Grand. Using a conceptual massing model of the building, the shading effect from adjacent buildings at various times of the year was determined (specifically, the mornings and evenings of both the equinox and solstice) as shown in Figures 2-5. This study utilized Autodesk’s Ecotect Analysis software engine.
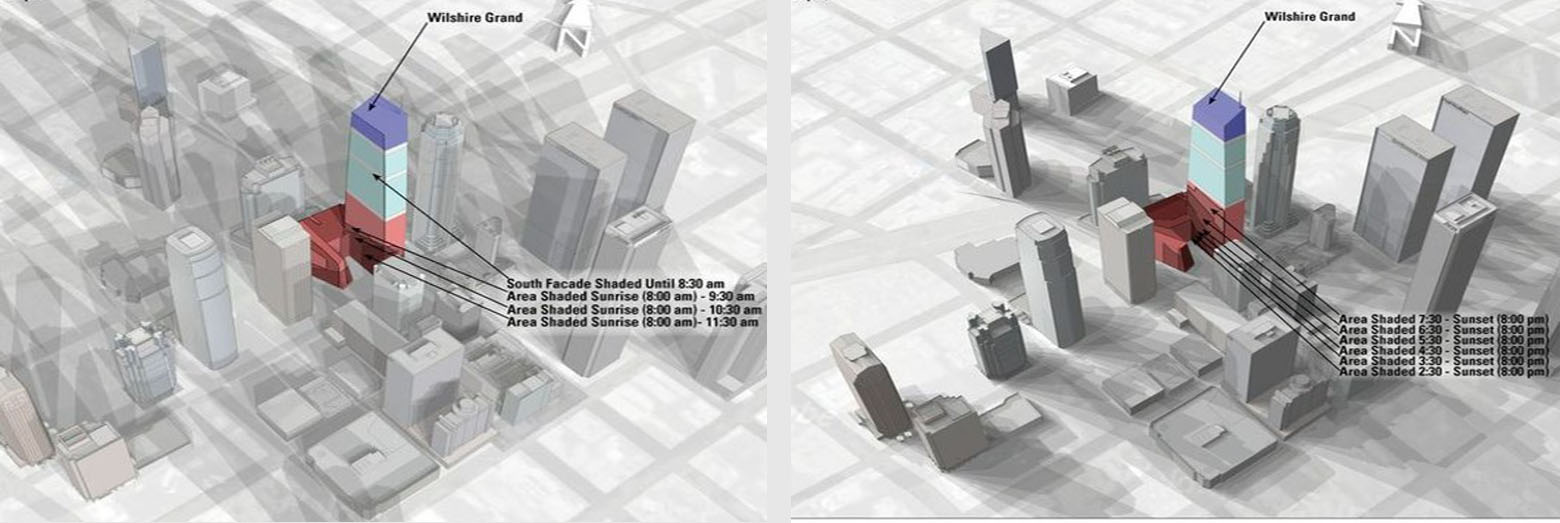
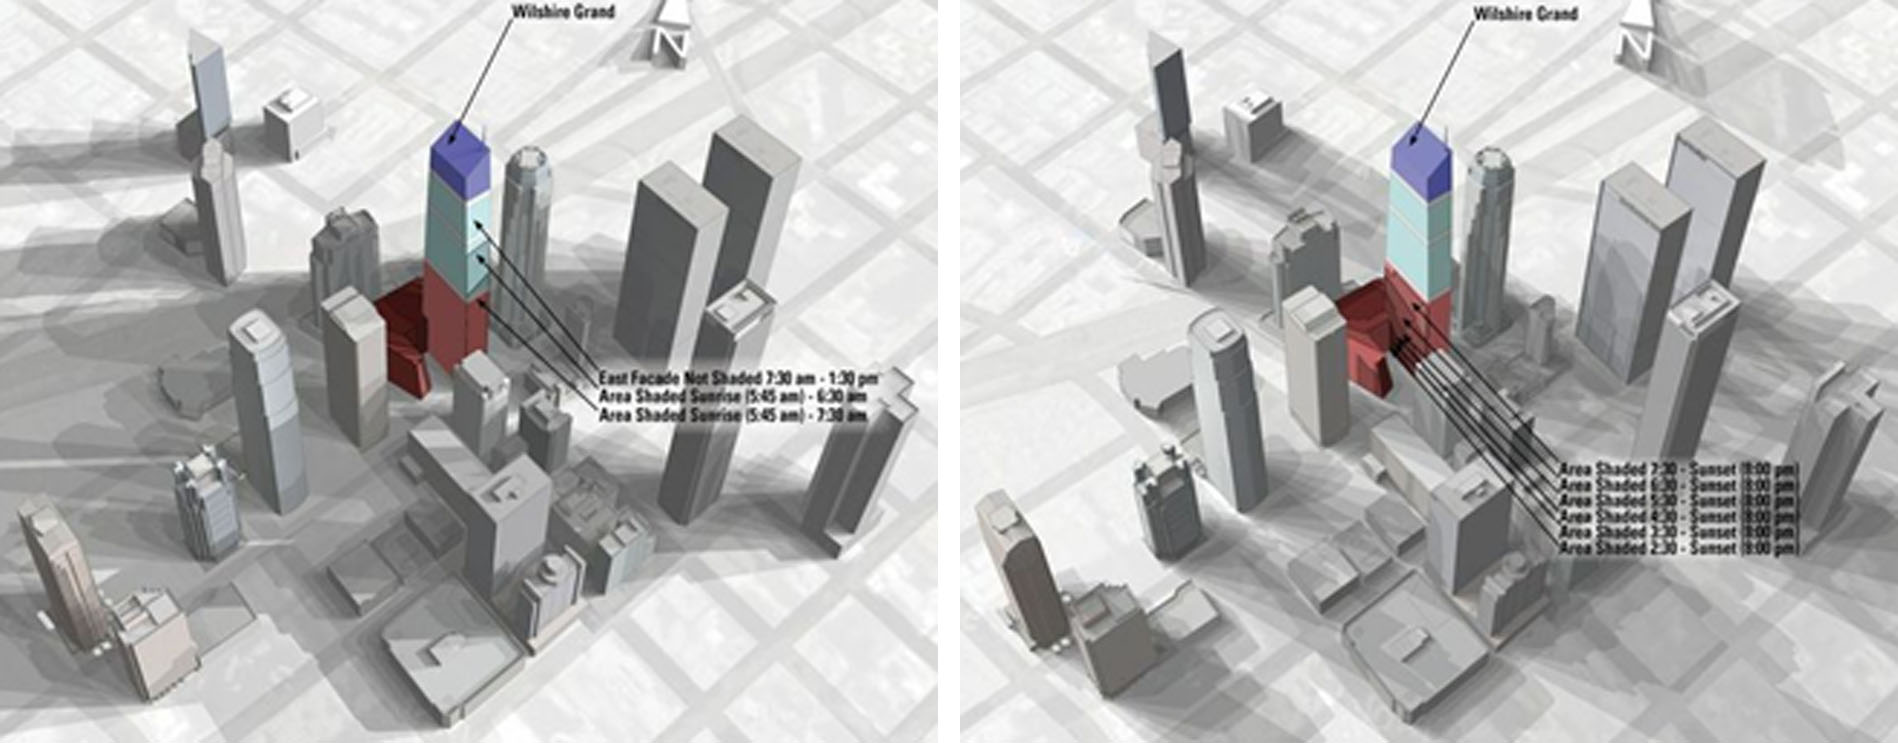
These studies illustrated the extreme sun angles throughout the year and informed the team how a unique pattern of glass type and shading devices can be designed to create a visually interesting, cost-effective, and high-performance envelope. Portions of the façade that receive more direct solar insolation can potentially be designed with more shading or lower SHGC. For instance, the podium of the building receives the least amount of sunlight and therefore could have a clearer, less-glazed window.
Method: Window-to-Wall Ratio
After establishing the impacts of shading from neighboring building and determining which parts of the building would be most affected by solar heat gains, a simplified energy model was created based on hand sketches from AC Martin. Figure 6 shows initial concept sketches for the building. The original building skin concepts developed included a visible glazing percentage of roughly 80% of the building’s facade.
California’s state energy code specifies a maximum window-to-wall ratio (WWR) of 40%. A WWR greater than the maximum must be compensated for through other energy efficiency measures, typically more expensive methods. The project team performed a WWR study by creating three simple energy models of the building, each with a WWR of 50%, 55%, and 60%. The energy modeling software eQUEST was used to estimate the total annual energy lost through the building envelope for each model, which was compared to the baseline Title-24 code design. The results of this analysis determined what WWR was the right balance of aesthetics and energy performance.
Method – Glazing
In order to analyze the effect of the glazing type on the performance of the envelope, a more sophisticated model was built in eQUEST, which incorporated the mechanical systems, occupancy and other energy-consuming aspects of the building. Creating an eQUEST model using the architectural Revit geometry ensured that the energy model fully captured all physical details and space programming. Images from this eQUEST study is shown in Figures 7 & 8. The energy model also gained insight into the building envelope’s effect on energy usage, sizing of MEP systems and perceived comfort level of occupants. The project team assigned the model a WWR of 50%, R-16 spandrel insulation, and no shading devices.
Multiple Viracon products were chosen as possible candidates for the north and non-north windows of the building, with varying Solar Heat Gain Coefficients (SHGC), visible transmittances, and U-values. These glass products were assessed in the Wilshire Grand’s energy model, which provided an estimate to the annual electricity and natural gas consumption for each option. Translating the estimated energy savings into an annual energy cost, the financial impacts for selecting glazing was determined and compared to the baseline code model.
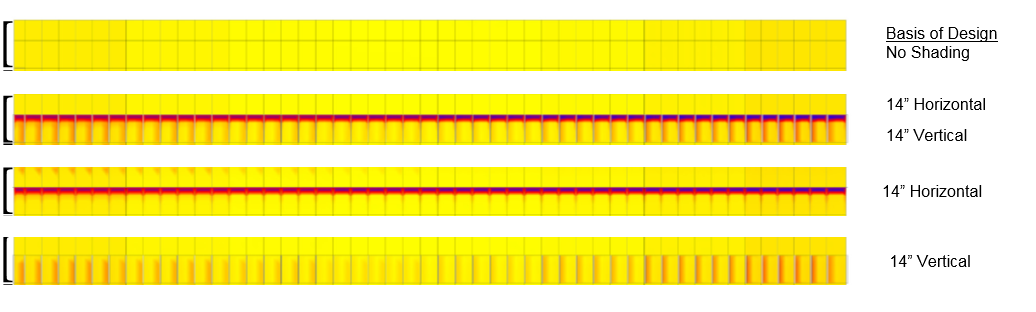
Method – Shading Devices
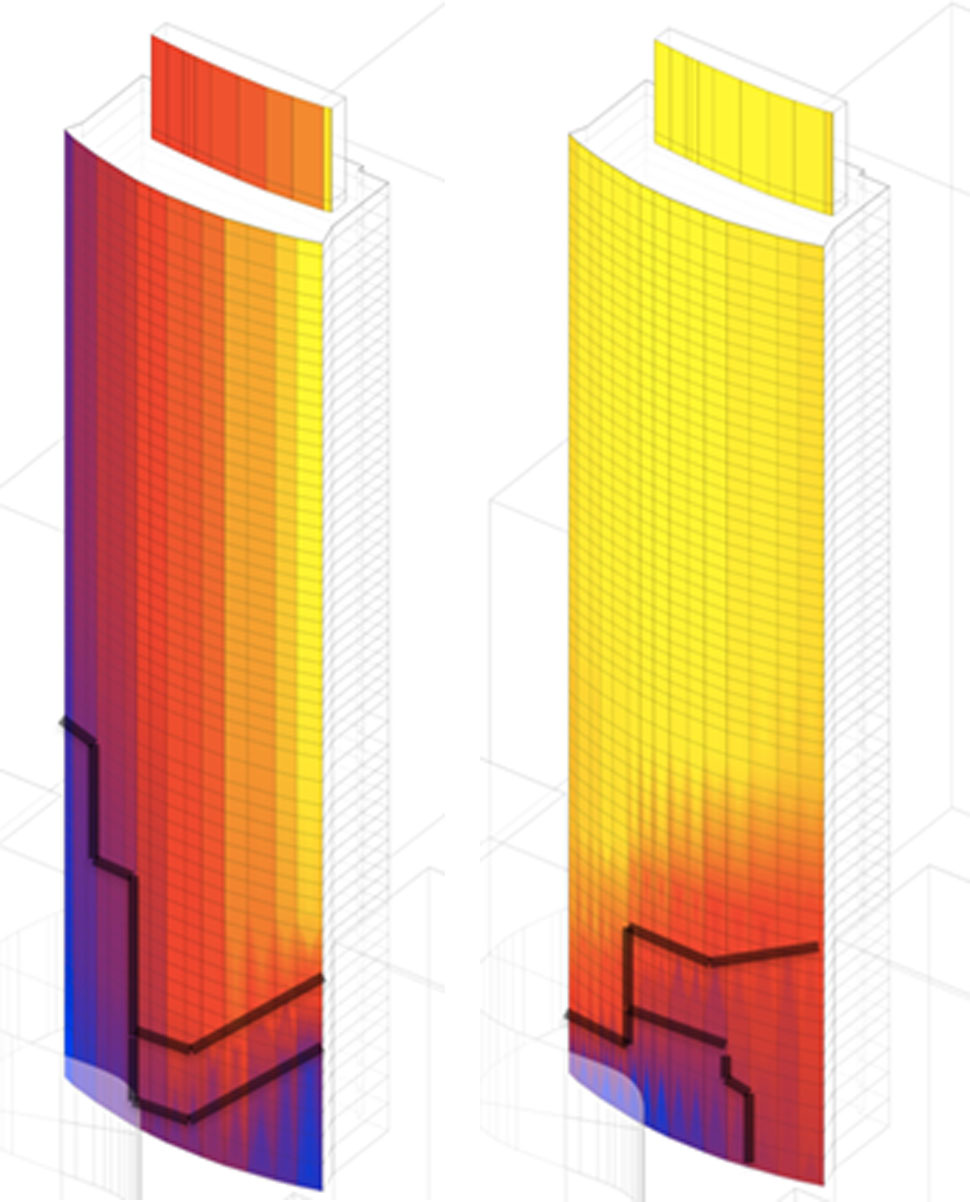
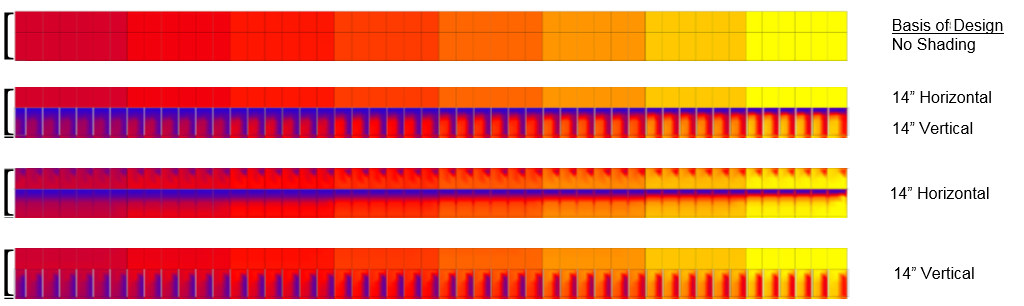
The method for assessing exterior shading devices utilized the Ecotect software to determine how much solar radiation could be mitigated from entering the building. The shading scheme was focused on the south façade of the building, which will receive the majority of direct sunlight throughout the year. Figures 9 & 10 show the pattern of solar radiation on the Wilshire Grand’s south façade with no shading devices to serve as a baseline comparison. The color scale represents the total amount of direct solar radiation received with yellow being the highest, red being a medium amount and blue representing the lowest areas.
Using this knowledge various iterations for both horizontal and vertical shading were assessed, including uniform fin depth as well as varying depth. The depth of the horizontal and vertical fins along the south façade of the building was considered in effort to map the pattern of the shade cast upon the façade by neighboring buildings, thereby maximizing shading potential and minimizing material costs. Another option considered was recessing the windows by 8 inches from the spandrel, which effectively creates 8-inch fins on all sides of the window but without the added fin material costs.
Data-Driven Design
The data and insights gained through energy modeling helped the team to make informed decisions about the envelope design, which ultimately resulted in a more energy-efficient building, helping the owner’s bottom line with reduced energy costs.
Data – Window-to-Wall Ratio
After assessing the MEP systems and the impacts of increased window heights, it was determined that the WWR would ultimately fall within the range of 50-60% and these values should be assessed in an energy model. Table 1 below describes the overall impact on energy usage that a 50%, 55%, and a 60% WWR would have at the Wilshire Grand compared to the code baseline if 40%.
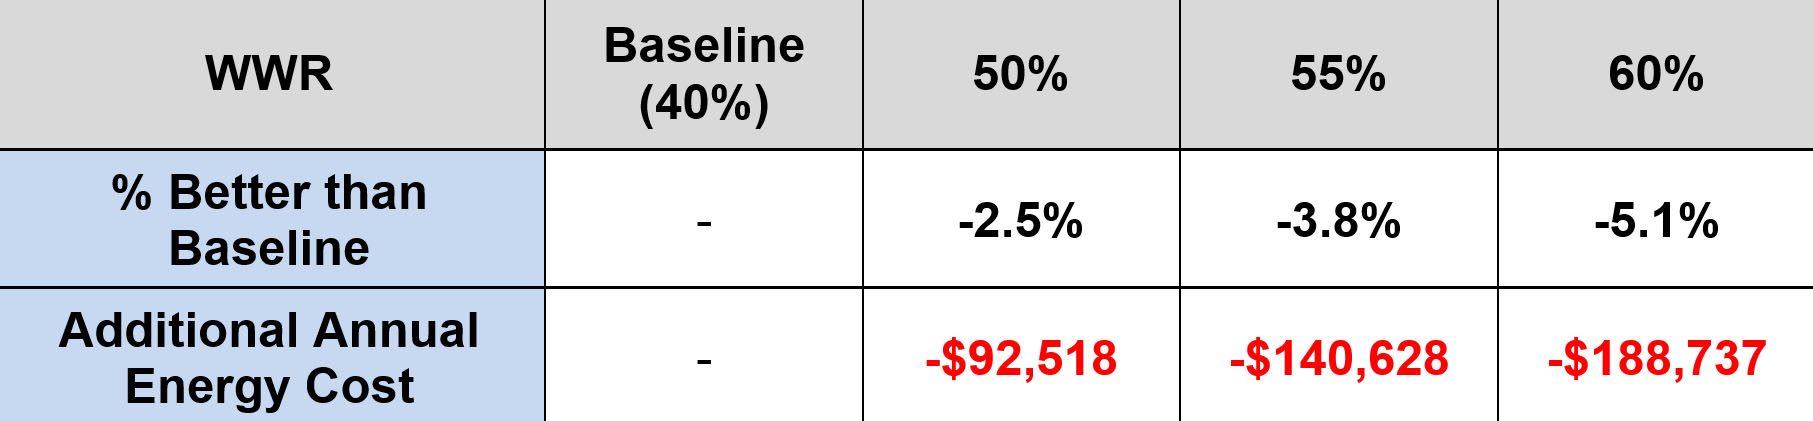
The results showed the 60% window ratio was estimated to increase the overall energy usage of the building by 5.1% and result in an additional $188,737 of energy costs per year. The added energy costs for a higher window to wall ratio ultimately let the design team to settle on a 50% WWR in order to maximize building efficiency and thermal comfort. It was found that this ratio allowed for adequate natural daylight to enter the space, while significantly reducing heat loss and gain through the facade. Using the results of this study it was estimated that an 80% WWR would have resulted in roughly a 10% energy efficiency penalty and $375,000 in additional annual energy costs.
Data – Glazing & Insulation
After establishing a WWR for the building, multiple glaze options were assessed for the Wilshire Grand’s window assemblies. Window types were studied on the on the north side of the building versus the east, south, and west facades based on the results of the shading study. The North side of the building received significantly less solar radiation compared to other facades and therefore could accommodate clearer glass without significantly affecting the HVAC loads. The various iterations tested the effect of varying solar heat gain coefficients (SHGCs) and quantified the estimated energy savings overall. Table 2 and Figure 11 below show the results of the glazing study.
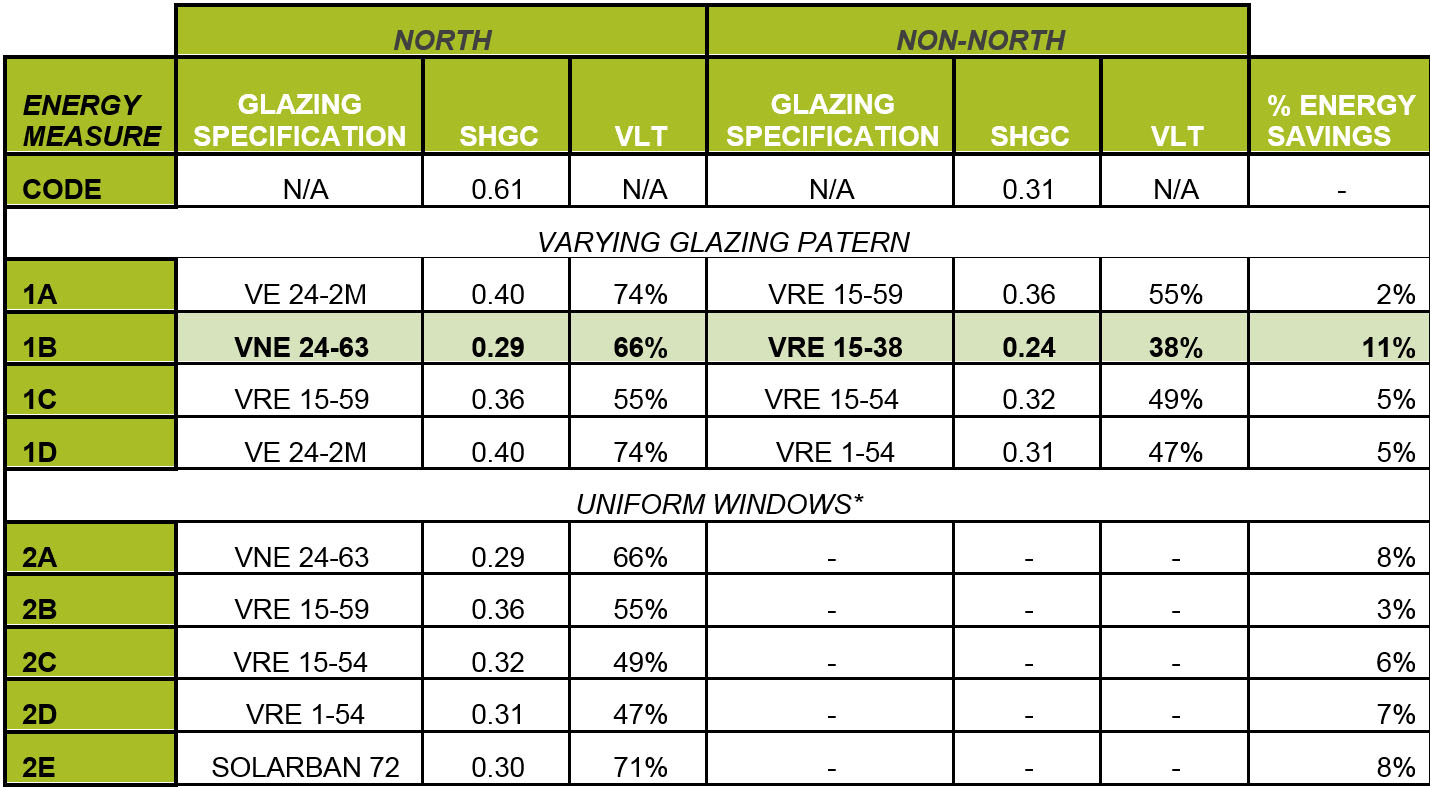
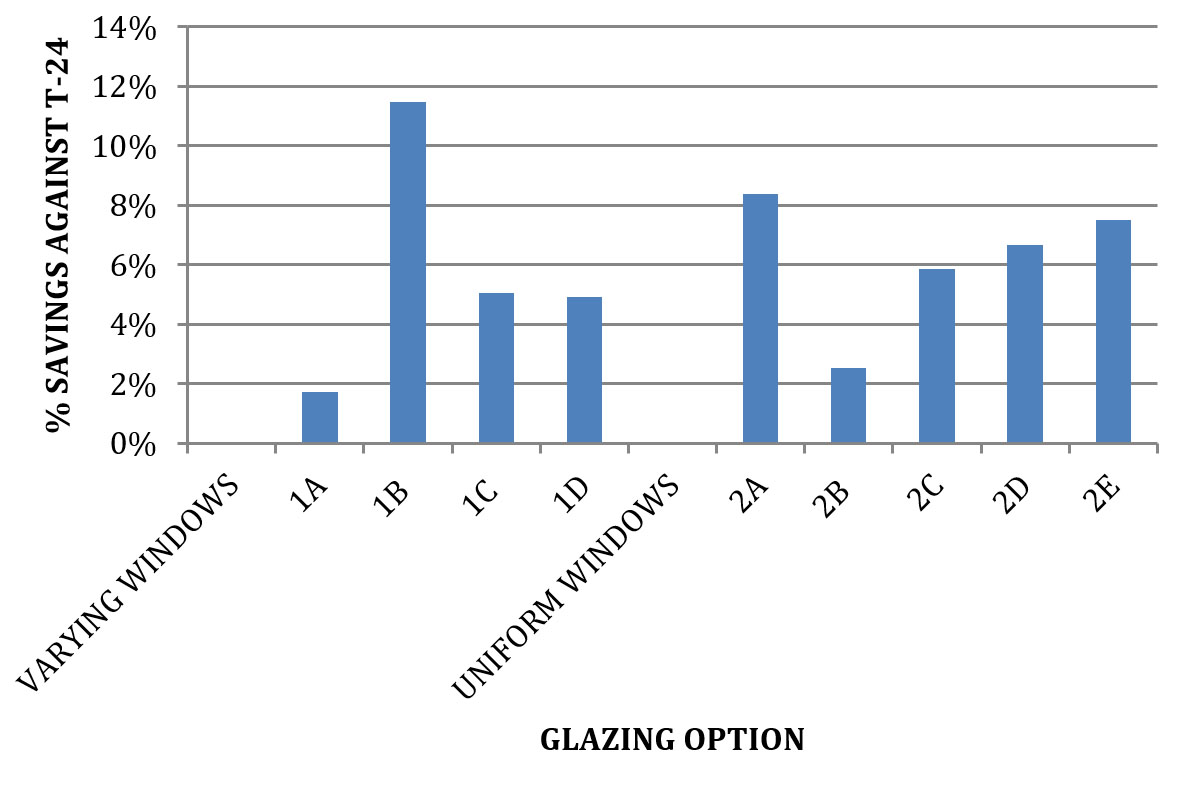
It was determined the SHGC of the window assembly had a significantly impact on the overall building’s performance. Energy efficiency measure 1B (highlighted) showed a savings of 11%. While none of these glazing options were eventually selected, this ultimately led to the design team specifying high performance low-e coating throughout building. In Los Angeles’s climate, the heat gain from the sun can have a dramatic impact on the HVAC loads and therefore should be more aggressively mitigated. The south/north sides of the tower were specified with VRE 1-38 (SHGC – 0.23, VLT – 36%) and the east/west sides of the building were specified with VNE 13-63 (SHGC – 0.29, VLT – 66%). The shading studies led the team to specify the lowest SHGC on the south side. While the north side of the building did not benefit as much from energy savings, this glass maintained the desired consistent look for the building. The east/west side glazing selection was also better than code baseline and allowed for visible light to pass through. VNE 13-63 was also used for the storefront at the base of the building, a significant improvement compared to standard monolith glass. This variation in glazing patterns at the Wilshire Grand can be seen in Figure 12.
Ultimately the results of the glazing and shading studies resulted in four different glass types to be specified on various parts of the building. These selections all balanced reflectivity, visible light transmittance, and solar heat gain specifically for the location they would be used on the building. Low-e vision glass was chosen to cover the bulk of the tower to mitigate solar heat gain and a frosted insulated laminating glass runs up the spine of the tower to provide an eye catching architectural detail. A third glazing was selected for 10,000-square-feet sweeping atrium skylight to ensure a comfortable environment for occupants and ensure there is a clear view of the tower above. The porte corchere underneath the podium, which will receive virtually no direct sunlight, will have monolithic glass to accentual the grand entrance to the building. The combination of glazing specifications created a high-performing envelope that exceed energy efficiency targets and enhanced the architectural design. This was only possible through results gained from energy modeling and the direct collaboration of owners, architects and energy consultants.
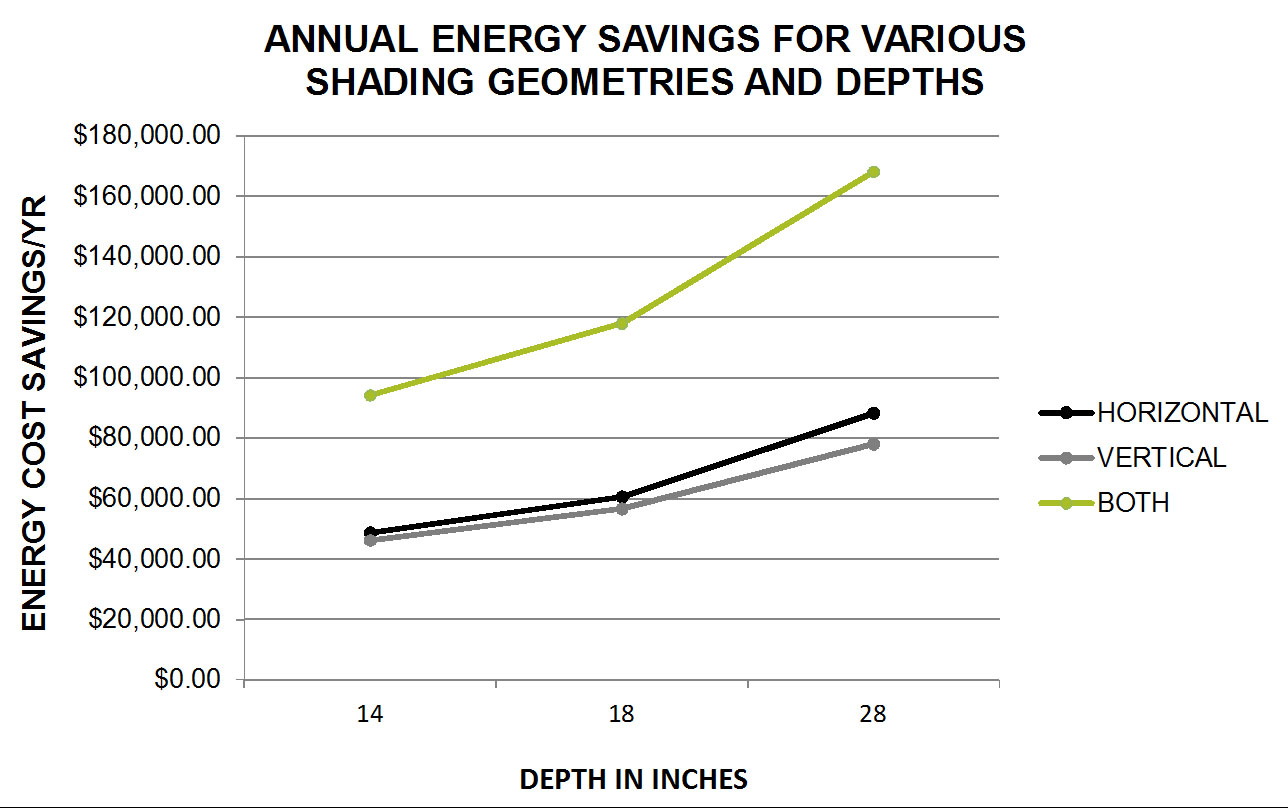
Data – Exterior Shading
Various exterior shading features were analyzed at the Wilshire Grand Tower using the Autodesk’s Ecotect software. This study was focused on the south façade as this side of the building received the most solar radiation. This studied included combination of differing sizes of varying shades (VARY), horizontal and vertical (H&V) shades and recessed windows. An example of the results of one of the shading studies (14” fins) is shown in Figures 13 & 14. The fins were found to be fairly effective at mitigating the solar gain and additionally would provide benefits for glare. The color scale represents the total amount of direct solar radiation received with yellow being the highest, red being a medium amount and blue representing the lowest areas.
Using this information, it was determined how much these shading devices could reduce the overall annual energy costs of the building, as shown in Figure 15. While 18” vertical and horizontal shades on the south façade could reduce the overall energy cost by roughly $120,000, this was not pursued due to the architectural effect of breaking up the all glass façade and additional first cost.
Data – HVAC
An efficient envelope works even better if paired in tandem with an efficient HVAC design. The HVAC design incorporates hydronic built-up air handling units with hydronic reheat for the podium and office levels, broken up floor-by-floor. The hotel guestrooms and support areas are supported by four pipe fan coil units, which corridors and ventilation air provided by hydronic dedicated outside air systems. The ground floor lobby and sky lobbies utilize radiant floor heating/cooling to efficiency create a comfortable environment. The central plant includes high efficiency chillers and condensing boilers to provided chilled and hot water to the entire building. Additionally, a stratified chilled water thermal energy storage tank was utilized to reduce the demand charges and to provide a peak shedding strategy.
Explanation
The solar, window-to-wall ratio, glazing, and shading studies led to an optimized façade design with significant energy savings, but in order to obtain above and beyond energy savings other energy efficiency measures needed to be implemented. By breaking up energy use into its respective end use components one can easily see which energy efficiency measures have the most dramatic effect on the overall energy use and can then drive the conversation to an integrated building design. Each energy efficiency measures end use breakdown was analyzed in comparison to the code baseline. The conclusion of this envelope study culminated in a report that broke apart the price and efficiency of each energy efficiency measure and façade decision. Relative to an ASHRAE 90.1 2007 Baseline the Wilshire Grand is estimated to save $896,428 annually on energy costs, a 24.2% overall energy costs savings. This savings could not have been achieved without the building’s high performance façade design.
Conclusion and Future Work
In studying the energy performance of the Wilshire Grand, the design team was able to create a dynamic envelope that successfully intertwines energy efficiency and aesthetic design. There is no doubt about the impact this building will have on downtown Los Angeles’s image, but that does not mean that it must make a sizable impact on the environment. The success of the Wilshire Grand was driven by the entire design team to working together and making informed design decisions from modeled and historical data. This process allowed the team to make compromises that balanced function, financials, performance, and aesthetics.
The design and construction industries are constantly coming up with new and innovative technologies to increase efficiency, drive down cost, and enhance the occupant experience in the built environment. As design trends move towards all glass buildings, smart design and construction, processes need to be implemented. Analyzing the energy model from an early stage allowed the architects and engineers to compromise on a total building solution and allow for innovative technologies to be implemented, thereby capturing maximum energy savings and allowing for a better design.
This project also raises some important questions for the design of future high rise buildings in California. Is it possible with today’s technology to have an energy-efficient (let alone code compliant) 100% glass façade? How should larger views and more natural daylighting be prioritized relative to increasing energy efficiency and thermal comfort? Do high rises fit in the future plan of net zero energy in California? The answers lie in the ability for all stakeholders to work together, which includes building occupants and policy makers. There is a need to work together as the state moves towards its net zero energy goals and rely on modeled and historical data to drive these code changes. Due to its scale, grandeur, and notoriety, Wilshire Grand will be used and an example to influence large-scale construction projects to come in the future.
REFERENCES
Article: Anna Scott (April 3, 2009). . LA Downtown News. Retrieved August 9, 2014.
Today’s technologies allow architects and owners to “dream big,” to design and construct more sophisticated facilities that provide unique and interesting experiences for the user. Architects are now collaborating more with their consultants and with contractors early in the design phase, and owners are providing “Big Rooms” for the entire team to meet and collaborate daily, face to face.
At the same time, increasing project complexity is requiring specialized expertise for design and construction. As a result, engineers have become “experts” in the various market sectors they service. However, this can create “silos of knowledge” that leave gaps in the project team’s ability to deliver energy-efficient and sustainable buildings. To resolve this issue of improving efficiency while making projects more cost-effective, disciplines must work together toward integrated design solutions.
At Glumac we are always looking for ways to provide integrated design solutions to improve energy efficiency.
Here are some opportunities to consider:
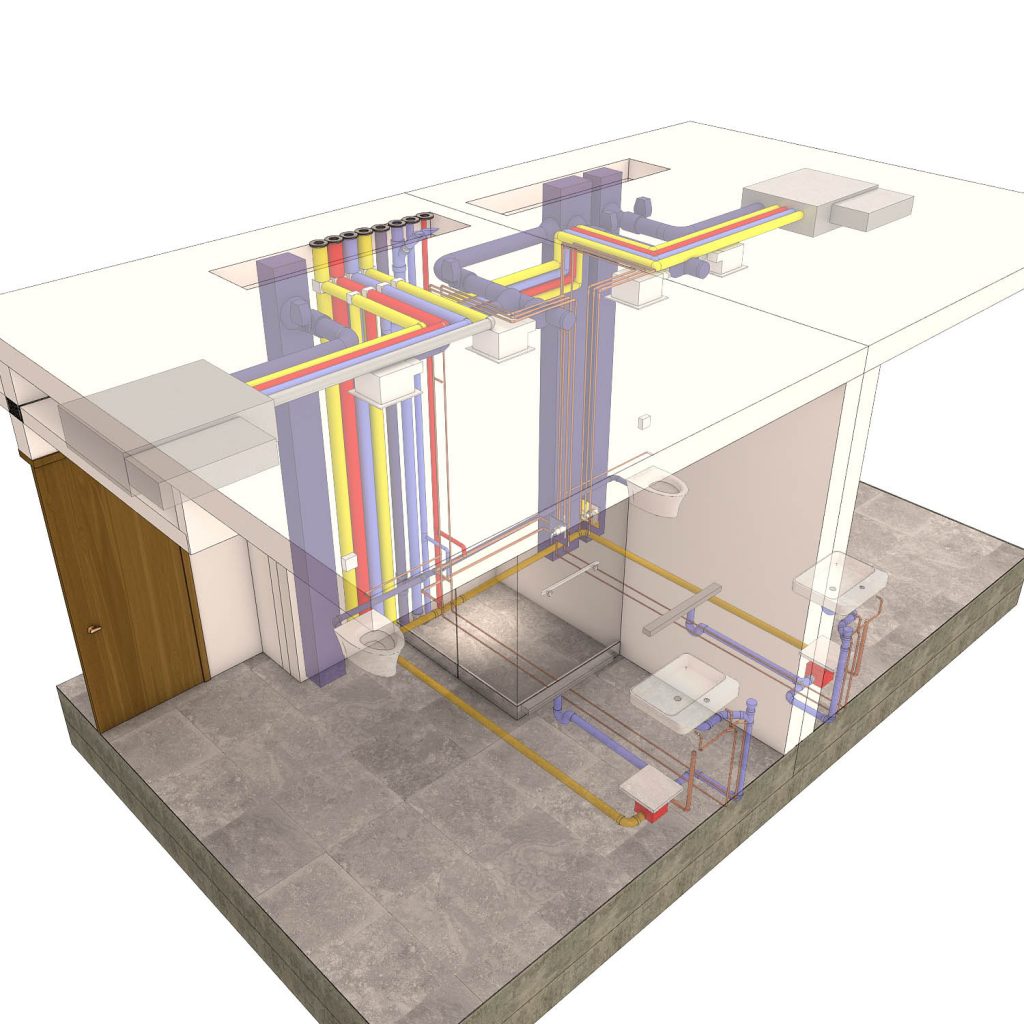
Prefabrication. Glumac is designing “Skid Systems” for major mechanical and electrical systems, and entire rooms. These skids are designed with full MEP systems and allow for continuous comprehensive commissioning.
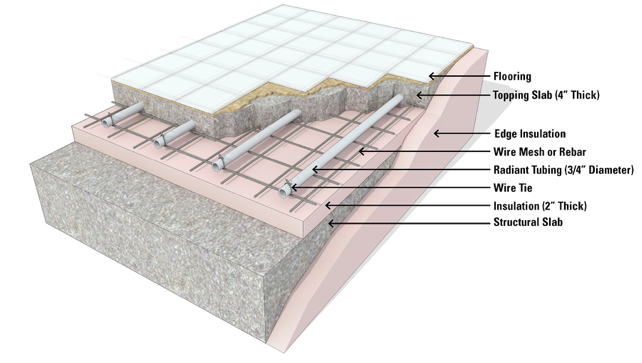
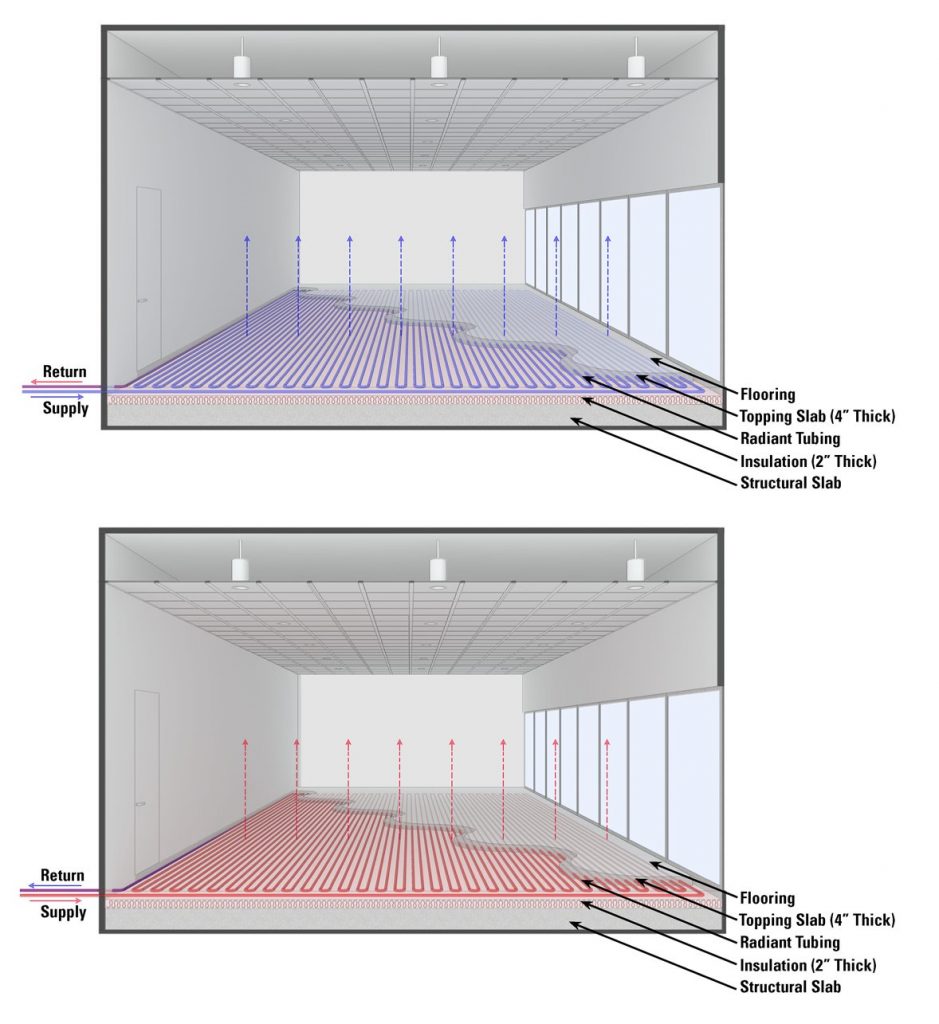
- Radiant floor slabs. Most commercial construction projects include concrete floors. In this type of environment, radiant floor slabs and cross-linked polyethylene (PEX) tubing can provide the majority of heating and/or cooling for the occupied spaces, provided the tubing is coordinated with the stressed tendons within the floor slab.
- Radiant ceiling panels. Cooling is typically provided from active or passive overhead chilled beams. Installing the PEX tubing within the structural slab above provides an economical and aesthetically pleasing means of routing the chilled-water supply and return piping. Similarly, the tubing must be coordinated with the stressed tendons.
- Thermal mass. Buildings with concrete floors and roofs provide an opportunity to flush the building during cool periods—with no mechanical cooling. This enables the facility engineer to modulate the HVAC system within the building and take advantage of the thermal lag during occupied hours.
- Auger piles. This is a common method for providing structural footings for buildings. Once the hole is drilled, a rebar cage is dropped into the hole, which is then filled with concrete. PEX tubing can be connected to the rebar cages to form a “geothermal pile,” allowing heat to be absorbed or rejected into the ground.
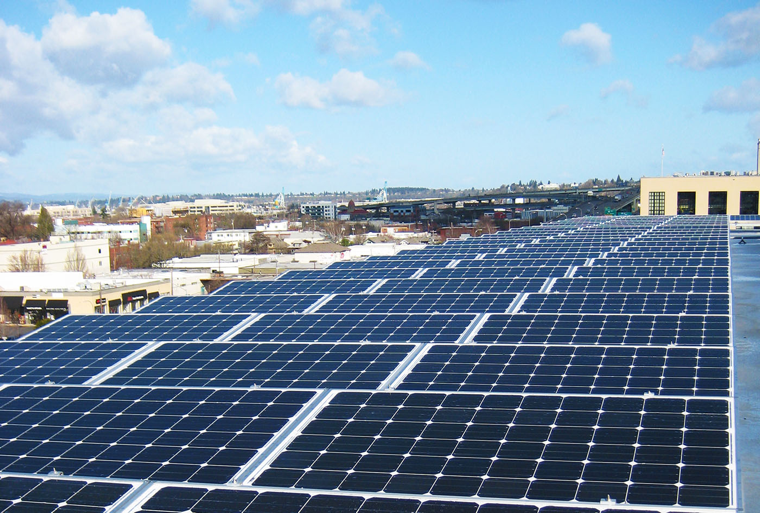
- Photovoltaic (PV) canopies. Building integrated photovoltaic (BIPV) panels can be connected to the façade to provide shading and/or equipment screening while generating electricity. Current PV technologies, such as glazing and roofing systems with integrated PV collectors, are other possibilities for generating electricity without having an impact on the structure’s architectural aesthetics.
- Integrated controls. Historically, each of the low-voltage trades have worked separately and independently, including lighting, fire alarm, security, audio/visual, and building-system management. Now, with fiber optics and wireless devices, these systems are being integrate to reduce costs, improve flexibility, and enable facilities engineers to quickly and easily modify set points and schedules. This enhances energy efficiency and tenant comfort.
- Thermal chilled-water storage. Many modern high-rise towers include a multilevel, below grade parking structure. Based on the requirement for a fire-water storage tank on the lowest level, there is often an opportunity to increase the size of the tank and provide a thermal separation, by adding a chilled-water thermal vault. The size of the water vault must be coordinated with the structural mat foundation to assure proper sizing and location.
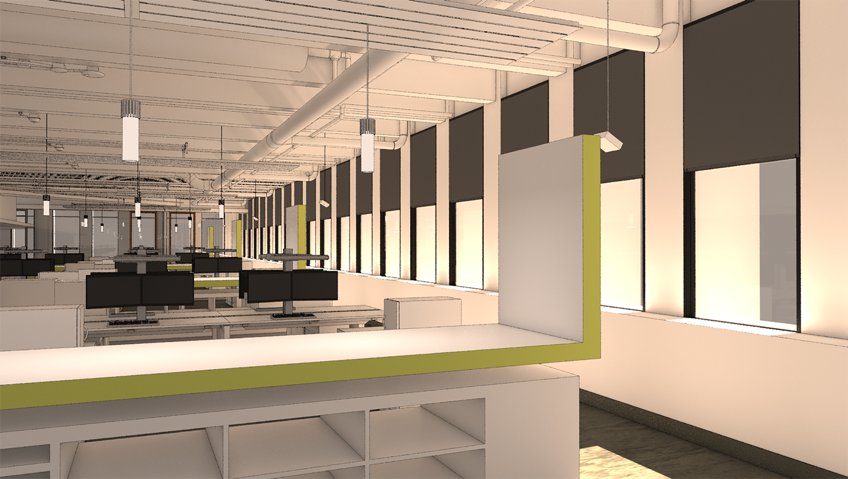
- Motorized shading. New technologies associated with motorized blinds and photo sensors enable multiple energy-saving and comfort opportunities. The programming allows the facilities engineer to close blinds during unoccupied hours to help reduce the cooling load and enhance energy efficiency. The automation function creates a comfortable space for occupants that is filled with natural light and minimizes glare.
As more architects and engineers in multiple disciplines begin working together collaboratively, integrated design solutions become more common and effective. Integrated design solutions need to be promoted to save owners money and provide better and more sustainable projects.
Since its launch in 2010, more than 20 million people have signed up for the Affordable Care Act. More than six million were previously uninsured. These numbers bear out a change in approache to the fundamentals of healthcare delivery, and the need for a shift in what’s required of a healthcare facility.
At Glumac, we wanted to open a discussion on how the A/E/C industry must adapt to deliver projects that work within the new model of healthcare business plans. So for StraightTalk 2016, we invited some of the industry’s best for a panel discussion on the new and adapting approaches to healthcare project delivery. In November, we were joined at the City Club of San Francisco by Jeff Fyffe, Jones Lang LaSalle; Stuart Eckblad, UCSF Medical Center; Karen H. Vegas, El Camino Hospital; and Bill Whipple, Sutter Health. Glumac principal and healthcare leader David Summers moderated the discussion.
Q: Everyone has a unique way of delivering an optimum project. Describe yours.
Stuart Eckblad: We’re a public entity. We don’t have the flexibility for what people call “pure IPD (integrated project design).” We do IPD-light. The key for healthcare is that people really need to recognize the delivery model needs to be flexible enough to accommodate change.
For example, an MOB takes three to four years to complete, a good facility takes eight. In that period of time, healthcare laws and practices may have changed two to three times. All delivery methods have issues. But the idea of collaborating gives us tremendous flexibility. That allows us in the middle of the project to make a major change to a building, and allow the team to treat that change as a separate project. That delivery model is the most receptive to the amount of change we see in the healthcare industry. We’ve saved millions.
The public system is different than the private system. And in healthcare, it’s important to accept change and be flexible to meet it, while being sensitive to budgets and resources.
Karen Vegas: We’re more interested in what we can get out of our teams. Everybody knows there’s a lot of work out there, so we’re figuring out ways to get successful teams together and build lasting relationships. That to us is more important than how we contract.
Jeff Fyffe: When we look at the different types and sizes of projects, we see the $20 million and less projects as ones we’re looking to pursue. On the larger projects, we are not seeing design build as a delivery method. History tells us that with clients they lose control, and lose participation.

Q: How do you procure a project that helps improve speed to market?
Bill Whipple: We’re looking to grow our partnerships in the AEC industry. We want to bring the partners together that we want to work with. On very complicated subject matters, we want to partner with you and improve your knowledge of the project subject matter.
We’re needing design professionals who can think in multiple design sets. We don’t need long design narratives from engineers. Just the key systems that were selected and the thought process that went into it. We’re also using a lot more data. There are eight different platforms we use in the planning process. We need to consolidate that, and we’re looking at databases on the planning side.
I think the UC (University of California) system is starting to learn this – the value is in the owner’s reputation. We have found in our projects we are attracting teams we want to attract, because of the reputation of our projects. What’s difficult is that this collaborative process is a great discussion, but there’s a gap in who can participate in that sort of process.
Jeff Fyffe: We’re looking for entities that can work together through difficult situations and do what’s best for the project. That sounds easy, but how many projects have you worked on where the moons were aligned and that project came together perfectly? We’re looking for a group that’s done it before and done it successfully. Of course, things are a little different for us, as we work across state lines. I would say we probably see other states a couple years behind in terms of being transparent and opening up to their partners, and understanding the benefit of an integrated approach.
Q: How do market conditions effect the way you want to deliver projects?
Karen Vegas: It forces us to be more flexible with how we want to contract. We’re looking to build new relationships with new contractors. Right now, we’re all pursuing you – which is great, but it jacks up the price, it’s not a buyer’s market.
In California, it takes five to seven, even 10 years to build a hospital. Our problem is now, as we wait every day, everything gets more expensive, the service we get from our design professionals is less, but we are paying more and more. We can’t move things quickly enough to justify the cost. Our credibility slips with our own administration. So we need to learn how to make choices on who we work with. It’s very hard to make these things happen in real time.
Q: Another delivery model that’s newer to the healthcare market is developer involvement in project delivery. Is that something your organizations look at?
Bill Whipple: Sutter Health has not done P3 (a public-private partnership). When we do engage developers, we access money at a 3 percent interest rate, developers usually around 7 percent. So it would have to make a lot of sense for us to go that route.
Stuart Eckblad: UCSF is a bit of a two headed organization. The campus side has done a few P3s, and have had some success, mostly with patient care facilities. On the healthcare side, we can borrow for a lot less. And that gives us more flexibility for change. We haven’t found an organization that can meet those requirements.
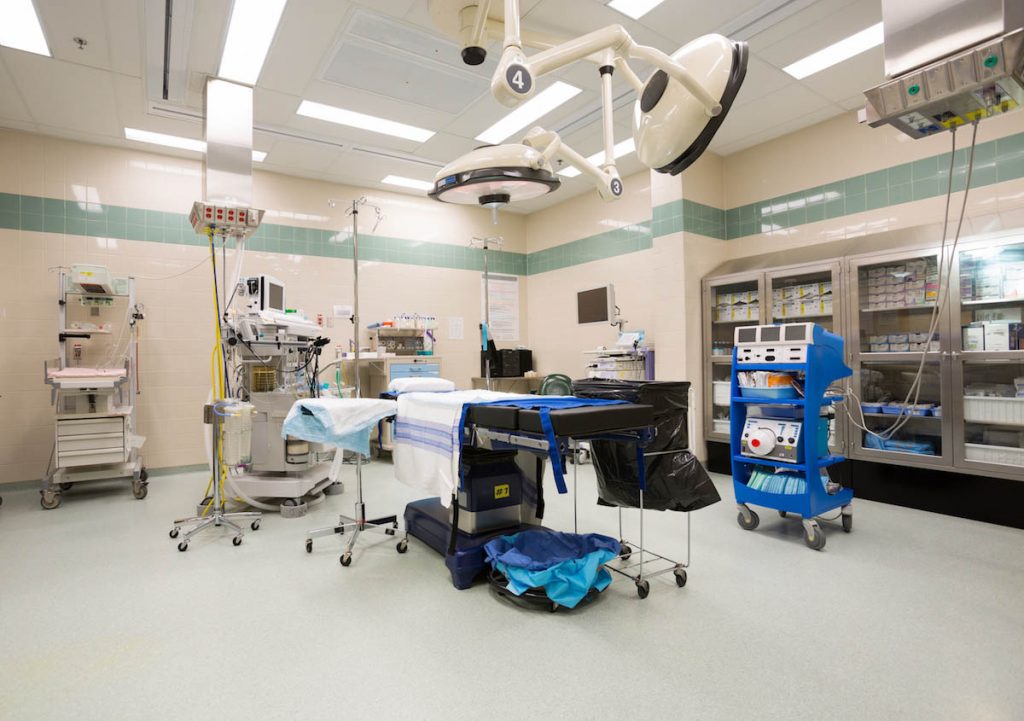
Q: What about pre-manufactured buildings? There are companies doing it for all kinds of projects. Can you tell us about your experience there?
Karen Vegas: I’ve tried to shed light on pre-manufactured facilities. And everyone likes it, but sale is a challenge. The healthcare industry is a legacy industry, so it’s difficult to try to convince people that they need to do some standardization and pre-manufactured at volume. We lobbied Congress to make pre-manufactured buildings possible. But we still haven’t figured out how to do that in the healthcare industry. People still aren’t interested in not being able to do incredible customization. My belief is that the industry will get there, but it’s a very slow time change. We have to get there. We’ve all talked about being faster/better/cheaper, but nothing changes. And pre-manufacturing isn’t a drastic change, since we deal with so much of it in our daily lives.
For example, everyone is building behavioral health facilities. In California, we’re going to be so far behind because it takes so long to build, yet we can’t except pre-manufacturing. We’re too busy deciding what type of bathrooms we’re wanting, or we worry it’s going to be ugly and not unique. That’s not necessary, and that’s not true.
Bill Whipple: I’ve been working on this idea of reducing the deviation in our projects. There’s a step we may be missing in figuring out how to limit the deviation in our projects before we jump to a pre-manufactured approach. The more we can standardize the better. We don’t need to redesign the exam room over and over again. Oddly enough, it’s on the clinical side where we have five different exam rooms and five different clinical models. I can certainly see a day where we start to narrow the variability, and I think it’ll bring a lot of sanity to your work.
Stuart Eckblad: In the academic world, its much different. We have 40 Nobel Prize winners who have clear ideas of what they want, and none are the same. So it’s a challenge. We wrestle with standardization. What we find is that the research changes healthcare so quickly that the room is not the issue. The equipment, the training program, how many people need to be in that room, and people are changing what rooms they use constantly. So it becomes hard to standardize. So we’re moving away from standardized facilities, and wanting to standardize production. What we’re trying to see what systems within the building can be standardized, and work from there. For example, in the cancer building we’re doing right now, we’re not only talking about how much of the room can we standardize, but also how much of the performance we can standardize.
Jeff Fyffe: We’re a long way away from modular buildings. We’ve seen an increase of the contractor’s ability to construct these buildings, which is driving prices down. But constant changes in the industry force us to look in other directions.

Q: How are pharmacy construction mandates effecting your projects?
Bill Whipple: There are multiple sites and smaller scopes of work. We’re in the throes of doing a lot of updates. How do we avoid small ADA upgrades – we’re approaching it as we need to make these kinds of upgrades, but we need a systematic approach to do this type of work. How do we manage these mandates? Leadership is getting the opportunity, even in pharmacy work, to reconsider the patient experience, and asking what the competency of a specific site is, and how it relates to the patient experience. These types of projects help create a system wide standardization around certain processes and procedures. We need to understand the fundamental value of what the work being done is. Can we avoid something as simple but terrible as the wrong prescription being provided to the wrong patient?
Karen Vegas: The mandates are making issues in existing buildings and bringing up a lot of unintended consequences. For example, we have maybe one patient a day who gets chemo in this small Los Gatos pharmacy, where we can’t easily make these mandated changes. So we decide to send them all the way to Mountain View, where we’re always doing construction, and no one can park. Then another unintended consequence is our reputation for service is damaged. And these mandates happen at a speed that is unmanageable with the construction process. They can be very expensive, and very disruptive for patients.
Stuart Eckblad: Three months after a healthcare facility opens, you start tearing the building apart. Codes change, things need to be moved, new ducts need to be installed, regardless of fit. So what we try and do in our capital planning is to understand that these changes will come. So we have to budget for that. For example, you’re going to need to set aside $20 million to manage updates. I can’t tell you tomorrow what that’s going to have to go toward, but you can bet it’ll be something.
Q: Jeff, as you work in multiple states, how do you see lessons learned transferred to providers in other states. We’ve talked about how newer facilities are being built in California, but Nevada for example hasn’t seen that same pace.
Jeff Fyffe: We talk to clients outside of California who are willing to just wait and see what California does, to see where healthcare is going to go. Their facilities are aged, but we’re not seeing them up until the last year or two changing their care model like we have here in California.
Q: Talking about the Affordable Care Act and how its changed the delivery model, we’re seeing more of a focus on wellness. How is that having an impact on facilities, both in the outpatient and inpatient realm?
Bill Whipple: We’ve built three smaller walk-in clinics. They were conceived with a new population who would want more access to care. It’s worth noting that there’s going to be a lot of these. And the speed to market is quick. We’re seeing the inclusion of pharmacy, nursing, social work, physical therapy, and then the ability to hand off one patient between the variety of services. We’re seeing how access to care is changing. Also, our emergency departments are expanding. There could be a day when we stop seeing our Emergency Department needs expanding, but we’re not there yet.
Karen Vegas: We’re looking for areas to open these clinics. And to address our Emergency Department issues we’re looking for urgent care. As we know, most people who go to Emergency Departments don’t need to be there. And we have the same challenge as others, we were behind with digital implementation. It effected Emergency Departments, notably in wait time. Everything has gone up two hours and stayed that way. Patient satisfaction has gone down, and so in response the community wants more Emergency Departments. It’s an unintended consequence. How do we keep up with this demand and still put out a good product and serve our patients?
Stuart Eckblad: We’re trying to increase market by moving patients more to outpatient care. That’s not a unique issue. We’re a primary care center, and what we see – and I think the industry will see – is that these centers will be based on acuity. What we’re seeing is two things – we’re trying to regionalize. Also home health – they Skype us, or we send a patient home with a connection so they can call in to their doctor, which means more IT. It’s fascinating. Our patients come from all over the world. How do you use this kind of technology to cure patients? Can we connect with China and other countries, where in some cases they’re ahead of us? I’m very interested in what the future of patient care is.
Jeff Fyffe: I’ve looked at stats from 2012-2015, less than 25 percent was in clinics and MOBs. 2016, it’s more than 60 percent. And we’re seeing a potential uptick in 2017.
Q: Looking 10 years out, where are the trends in terms of healthcare construction?
Karen Vegas: A recent study mentioned that in 10-15 years we’re going to be under-bedded in the South Bay. That’s part of the reason we’re buying new land. Also, when we bought our hospital in Los Gatos, we wanted to replace it on site, but we needed more land.
Stuart Eckblad: We have patients in our beds for months. I think we’ll continue to see an increase in primary care. Outpatient without a doubt will continue to grow. It’s not just the Baby Boomers. Right now Millennials are not showing up for care – but they will.
Jeff Fyffe: It’s cloudy. All the clients we’re involved with that focus on master planning think there will be less beds. But nobody really knows just when that’ll happen. There just isn’t a ton of evidence yet that supports that.
Bill Whipple: At Sutter Health we have branded helicopters and ambulances, transporting people to more centers of excellence. I think the reason for that is clinical outcomes. A cancer patient might be receiving a dose of a drug that costs $75,000 to make. By consolidating patients in these locations, we can help people receive different therapies in one day. Also, there are so many complex modalities, for example hybrid operating rooms. Clinical trials say why that’s coming out. New approaches to treatments and cures makes design difficult, and the complexity of care is going to increase.
Our in-house drone pilot recently flew over the Edith Green-Wendell Wyatt Federal Building in Portland, Oregon. Click below for footage of that flight and to see G-Force One in action!
For more information on G Force One, and to schedule a flight in your area, please email us at [email protected].
Filed under incredible acts of bravery: some of Glumac’s Portland staff rappelled down 16 stories of the 200 SW Market St building on August 20! As a part of the Rappel for Her Challenge, some of our brightest and bravest participated to fundraise for Girls Inc. PNW, and organization that helps young girls explore fields in STEM (science, technology, engineering, and math), As an engineering consulting firm, we aim to cultivate a new generation of female leadership in the AEC industry and support a diverse and vibrant workforce. We had an incredibly successful fundraiser, surpassing our original goal of $4,000, and raising more than $7,000! Thank you so much to everyone who participated!
We also were lucky enough to capture some amazing images of the event. Check them out below!
[R-slider id=”2″]
For more information on Girls Inc. PNW, visit their website, or reach out to us at [email protected].
Changes are coming to the Washington State Energy Code.
Written to maintain the state’s status as one of the nation’s leaders in sustainable building design, several aggressive updates have been made to the 2015 code, including requirements for dedicated outdoor air systems, and a series of sustainable design prerequisites project teams must choose from.
A new requirement for inclusion of a Dedicated Outdoor Air System (DOAS) stands to change how engineers and architects alike approach design. Designers are now required to decouple the heating and cooling system from ventilation systems. According to the new code language, HVAC systems should now include “supply-air temperature controls that automatically reset the supply-air temperature in response to representative building loads, or to outdoor air temperatures.” Because these systems have traditionally been linked, heating and cooling equipment have become major sources of wasted energy – pushing fans unnecessarily hard to maintain optimum comfort levels. The new approach will greatly reduce overcooling or overheating interior spaces, and mitigate wasted fan energy.
The change will force manufacturers to innovate new solutions, since packaged rooftop units will no longer be viable. There is a side benefit to the overall design, however. While HVAC systems will require more equipment, the overall size of that equipment could potentially decrease, creating the opportunity to increases ceiling heights.
Also new to the code is a selection of energy-efficient design strategies, of which design teams must choose a minimum of two to be code compliant. Of the available options, a focus seems to be on reduction of both lighting loads and fossil fuels usage. The code updates focus on enhanced lighting controls, a 25% reduction in lighting power, on-site renewable energy, and high-efficiency domestic hot water sources for 60% of the load (e.g. waste heat recovery or solar hot water systems). These features are designed to imbue future projects with greater efficiencies and sustainable designs.
These changes will add costs and additional design considerations. So it’s recommended that project teams take advantage of the interim year by providing alternative designs featuring the dedicated outdoor air system to allow developers and architects to adjust to the new pricing and timelines. This will help spread awareness of the new code, and avoid surprise costs once they truly go into effect.
Max Wilson, a senior energy analyst in Glumac’s Seattle office, is presenting an AIA accredited lunch and learn on the changes to the Washington Energy Code and how they impact our approach to sustainable building design. To request information on scheduling one in your office, please email [email protected].
In the spring of 2016, the Community and Aquatic Center in Sammamish, Washington, opened to large crowds of active adults and playful children. Created in collaboration with the YMCA, it’s a facility that realizes Sammamish’s goal of creating sustainable facilities for its growing population.
Along with architects Barker Rinker Seacat, the City of Sammamish, contractors Porter Brothers, and the YMCA (the project’s end user), Glumac had the responsibility of developing this community space. Glumac provided mechanical, electrical, plumbing, lighting design, and energy modeling. The team built the 60,000-square-foot facility adjacent to City Hall, the library, and the farmers market. It includes a six-lane pool, an activity pool, a two-story water slide, hot tub, two gyms, group fitness rooms, locker rooms, a track, and a community kitchen. The center’s location- adjacent to Sammamish’s library, City Hall and farmers’ market- enriches this community with more local engagement opportunities.
“Community buildings are gratifying because you know how they will get used,” project manager Michael Aliaga said. “They help build a legacy of engagement and vibrancy for a community.”
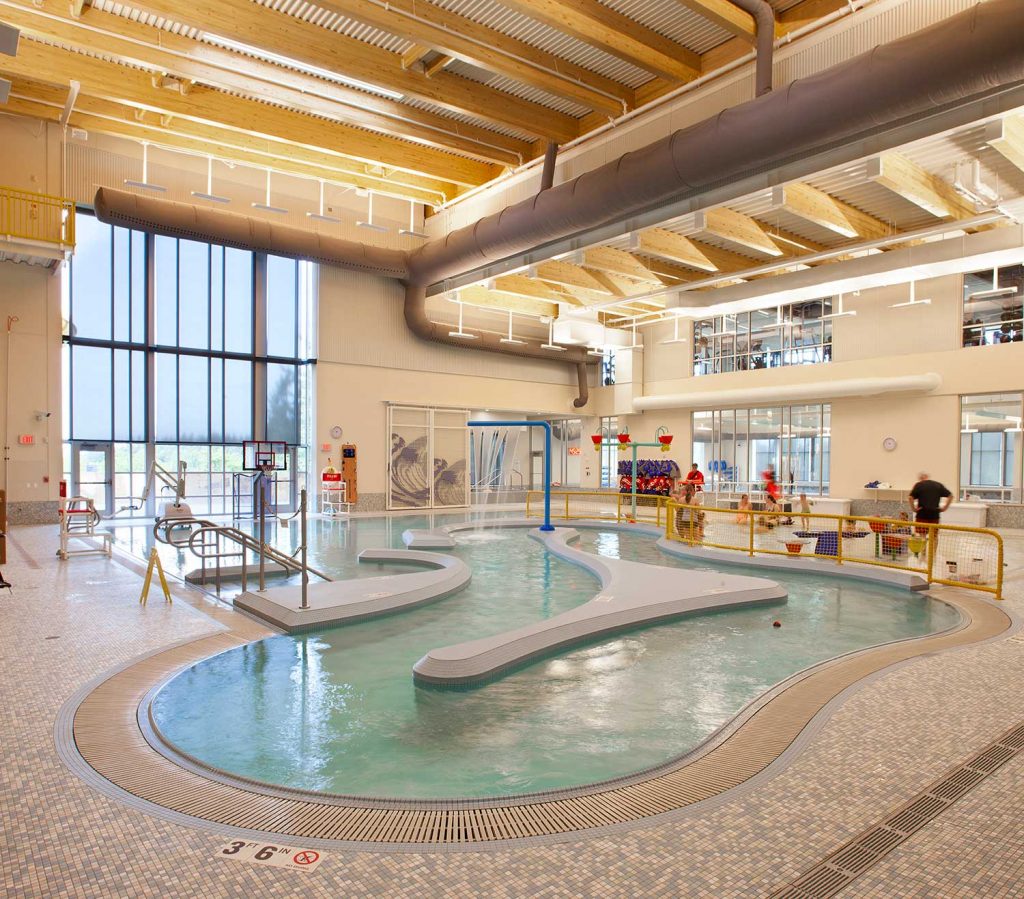
Lighting for Activity
In the pool space, Glumac’s Lighting Studio lead by Jesse Smith designed the first fully LED-lit pool installation in Washington and in the YMCA network. (LEDs are typically found in larger-scale projects, but the Community and Aquatic Center has roughly 90 percent LED lights throughout.) Smith designed indirect lighting over the pool, so a swimmer doing the backstroke will never have to stare at a harsh light, and the facility owners will never have to drain the pool to service the lights.
Smith also made the lighting controls flexible throughout the facility, in order to allow the Community and Aquatic Center to host many different events. For example, in the gym, Smith designed light fixtures that could light at 1/3, 2/3 or full brightness. That means facility operators can use more light for gym-goers on a cloudy day or less light for a more intimate event like a lecture.
“The design really allows for a wide breadth of usage,” Smith said. “While the community changes and evolves, the space can adapt to serve its needs, even if we don’t know what those needs are at this point.”
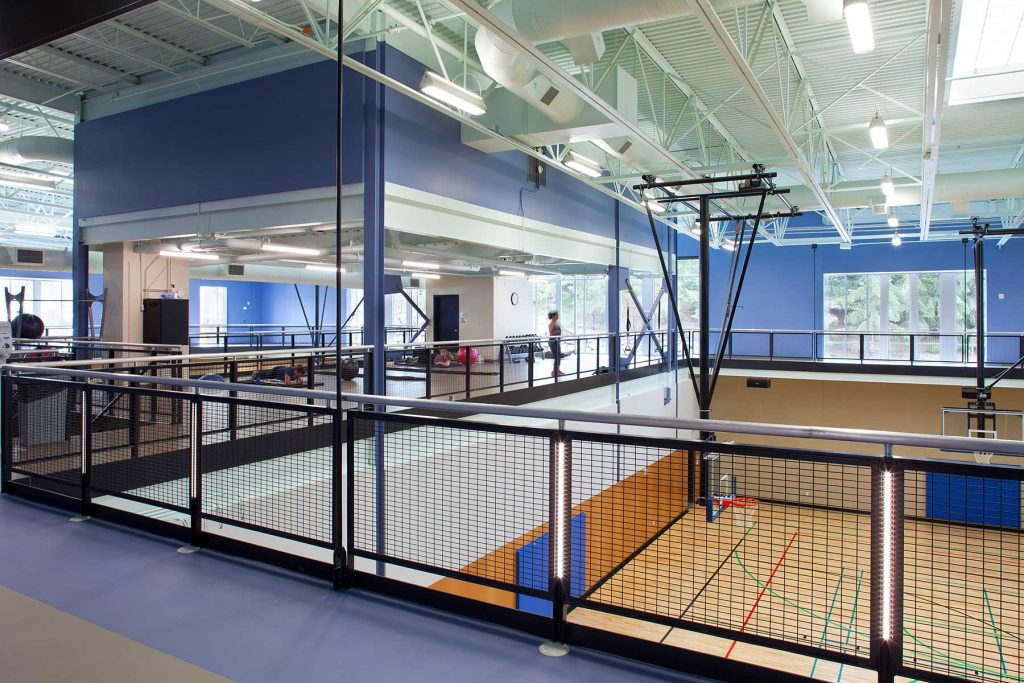
Energy Modeling
Glumac’s energy team helped reduce the project’s carbon footprint. Pool spaces typically use a lot of energy, due to the need to constantly move air, in order to push out chlorine particles and keep the air clean and safe for swimmers. So, Glumac modeled a combination of systems that used heat recovery in the pool area and a high-efficiency HVAC system in the support spaces, in order to minimize energy use.
Additionally, the exercise rooms have dimmers, so users can light the space up for karate practice or lower the lighting for meditation. Not only does this allow for a more positive user experience, but having the option for lower lighting results in energy savings.
Glumac’s plumbing staff teamed up with the project’s civil engineers for innovative water conservation. The civil engineers established paths for rainwater to collect not only from the roof but from the entire site. From there, Glumac assisted with the graywater’s filtration and distribution, and it is used for flushing the entire building’s toilets.