
In the past two decades our industry has seen a significant shift toward a focus on energy efficiency and sustainability. In order to properly gauge whether this shift has had a quantifiable impact, terms such as Energy Use Intensity (EUI), Power Use Effectiveness (PUE), and Gallons/Day have become commonplace. These simplified metrics are useful tools in tracking the performance of a building, but they have limits. For example, an airport may be a hub for popular airlines and see higher traffic than a similarly-sized airport on the other side of the city. The resulting higher energy use per square foot would be a mark of failure rather than a success of building performance. But that’s not accurate. To be truly efficient, we need to rethink our metrics, not to shift the goal posts, but to more accurately measure performance.
In both new construction projects and existing building operation, Energy Use Intensity (EUI) and Power Usage Effectiveness (PUE) for data centers are used as benchmarks, and performance goals are determined in terms of an improvement from that benchmark. EUI has in many ways become the miles per gallon (MPG) rating of the building industry. And like MPG, EUI has its limitations. It is commonly understood that a vehicle rated at 25 MPG is quite efficient if that vehicle is a pickup truck, but not exceptionally efficient if it was a subcompact sedan. Similarly, a hospital with an EUI of 120 kBtu/ft2/year could be considered quite efficient, but an office with an EUI of 120 likely has significant operational and equipment deficiencies. It’s not a simple apples to apples measurement.
EUI can be a valuable metric when comparing performance of similar buildings, or used as a starting point in energy analysis, but it may not tell the full efficiency story. Moreover, energy costs are a relatively small component of the bottom line for a business. In fact, in a typical Los Angeles office space, annual employee compensation is approximately $300/ft2 and rent is roughly $36/ft2/year, while energy costs are about $1-2/ft2. That said, these three figures are interrelated, and investments in energy efficiency can improve a business’ bottom line if they result in increased employee productivity. With that in mind, what if we started using employee productivity as a building performance metric?
“A performance metric that considers a true measure of the building’s success as it relates to its core purpose is more appropriate.”
To get a better sense of what this might look like in a real-world application, let’s compare two competing retail stores of similar size and type in the same geographical area. Store A sees twice the revenue as Store B, so as a result of its success, Store A is open for business 80 hours a week versus 60 hours for Store B. Assuming the shells of both buildings are insulated to the same levels, and lighting and HVAC systems operate at similar efficiencies, one would expect Store A to have an EUI at least 30-40% higher than Store B. Does this mean that Store B has a more energy-efficient facility? Probably not. Does Store B have a smaller environmental impact than Store A? If you consider the fact that Store B may have more unsold food waste than Store A, then likely no. Is Store B more successful at achieving its core purpose than Store A. Definitively, no.
In this example, a performance metric that considers a true measure of the building’s success as it relates to its core purpose is more appropriate. Therefore, normalizing energy use by number of customers served, number of cash register transactions, annual operating hours or pounds of food sold may be more indicative of efficiency than EUI.
Let’s explore the use of such “advanced metrics” to establish more appropriate benchmarking targets and for more meaningful comparisons between buildings during design and in operation. By selecting more appropriate metrics, building design teams and energy managers can improve understanding of true building performance, environmental impact and identify areas of improvement. ENERGYSTAR Portfolio Manager does this to some degree, asking high-level questions such as number of hours in operation per week for a building and number of computers within a space, for example. And yet, instead of focusing on targeting ENERGYSTAR scores our industry still focuses on EUI.
Importance of Performance Metrics
Performance metrics are vital in determining how efficiently or effectively a facility is operating, or is designed to operate. By compiling measured energy, water, and waste effluent data into databases such as ENERGYSTAR Portfolio Manager, benchmarks can be established for various building types and buildings in different climates. Benchmarks are then used as starting points in designing new facilities or investigating energy cost savings opportunities in existing buildings.
Building energy codes in many jurisdictions in the U.S. are beginning to put requirements in place that mandate building automation systems (BAS) capable of logging data. Some U.S. cities and states require benchmarking and disclosure of energy data. [1] When performance monitoring becomes standard, energy codes may then start to require energy efficiency targets be verified in operation. When this is the case, traditional metrics like EUI may not be appropriate for every building type. Advanced metrics for different building types will provide a realistic means of achieving these energy targets.
Airports
While energy costs can represent a small fraction of total operating costs for a tenant in an office building, they are typically the second highest cost after employee compensation for airports. [2] This puts pressure on airport energy managers and facilities managers to assess, monitor, and continuously improve energy efficiency. The challenge is that industry-standard benchmarks are not well established.
As with the retail store example above, EUI has its shortcomings in relation to airports. A Texas A&M University study found that EUI varies widely between airports of different sizes (floor area, ft2), with small airports having the highest average energy costs per square foot, followed by large airports. Medium-sized airports tend to have the lowest energy costs per square foot. [2] Because of this, EUI may not provide a meaningful benchmark for a facility. Therefore, it is difficult to determine potential energy cost savings and find energy end-uses to focus on.
For more details on our airport experience, head over to our project portfolio at glumac.com
When normalizing energy use by Traffic Units, however, a pattern begins to emerge. A Traffic Unit (TU) is defined as a passenger enplanement or deplanement, or 100 kg of cargo incoming or outgoing. FIGURE 1 below shows the annual kBtu/TU value for the most part falls within 10 and 40, with a few outliers. Only the smallest airports have kBtu/TU values much higher. [3]
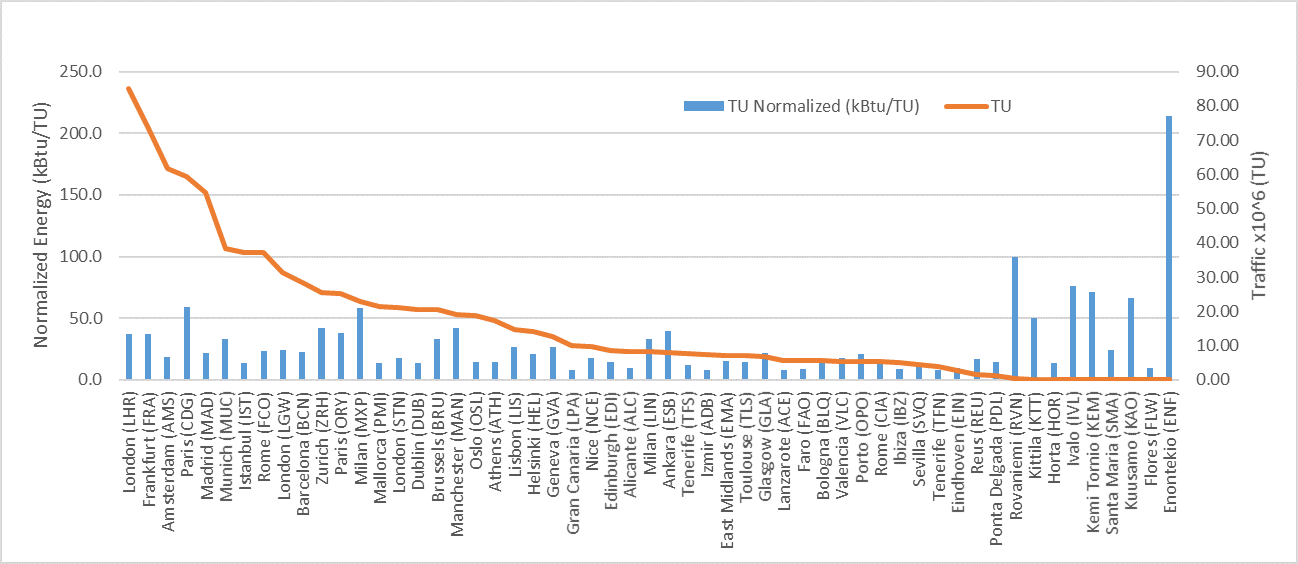
Figure 1. Annual energy consumption of select European airports, normalized by Traffic Units (TU). For 2009-2010 (Source: Salamone)
Traffic Unit (TU) energy values provide a more meaningful representation of how efficiently an airport operates since it considers how much passenger and cargo traffic the facility handles. Annual TU can be thought of as a measure of productivity for an airport, just as throughput captures productivity in the manufacturing industry and revenue for an office space. But whereas a linear relationship between floor area and production capacity can be assumed in a manufacturing plant or an office building, airports vary widely in layouts and space functions so the relationship is not as firm.
Comparing London Heathrow and Amsterdam Schiphol airports exemplifies the appropriateness of normalizing energy use by TU rather than floor area. FIGURE 2 below shows a comparison of EUI and TU-normalized energy use for the two airports for 2009-2010. The EUIs are both approximately 150 kBtu/ft2/year, with Amsterdam Schiphol slightly higher. But London Heathrow has a significantly higher kBtu/TU value than Amsterdam. Were an energy manager at either airport to use EUI to benchmark their facility’s energy use, they may assume that their facility’s efficiency is in line with a comparably-sized European airport. But the discrepancy between the two airports indicates that inefficiencies exist in London Heathrow’s operations.
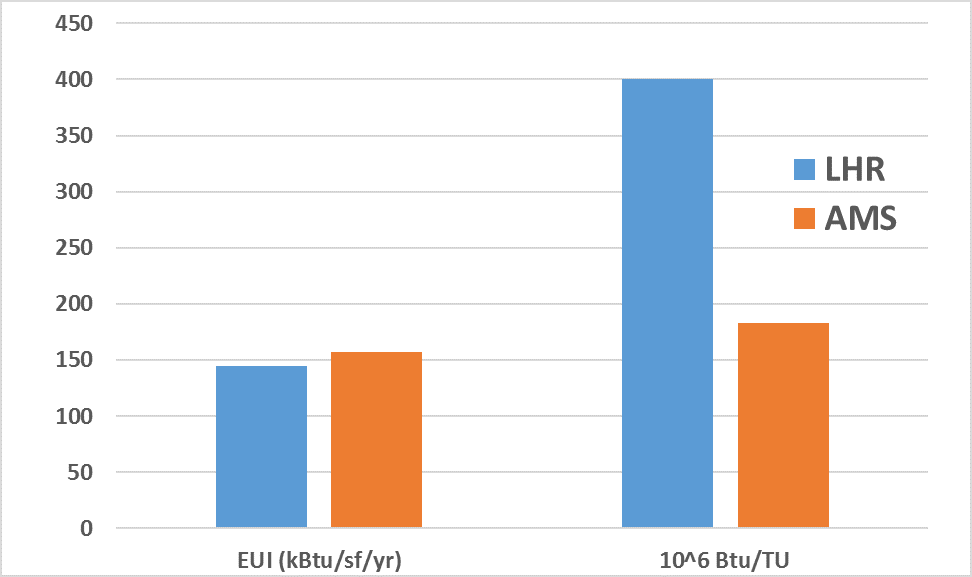
Figure 3 below helps explain the discrepancy shown in FIGURE 2. While the airports handle a similar amount of traffic, the floor area of London’s buildings is more than three times that of Amsterdam’s airport.
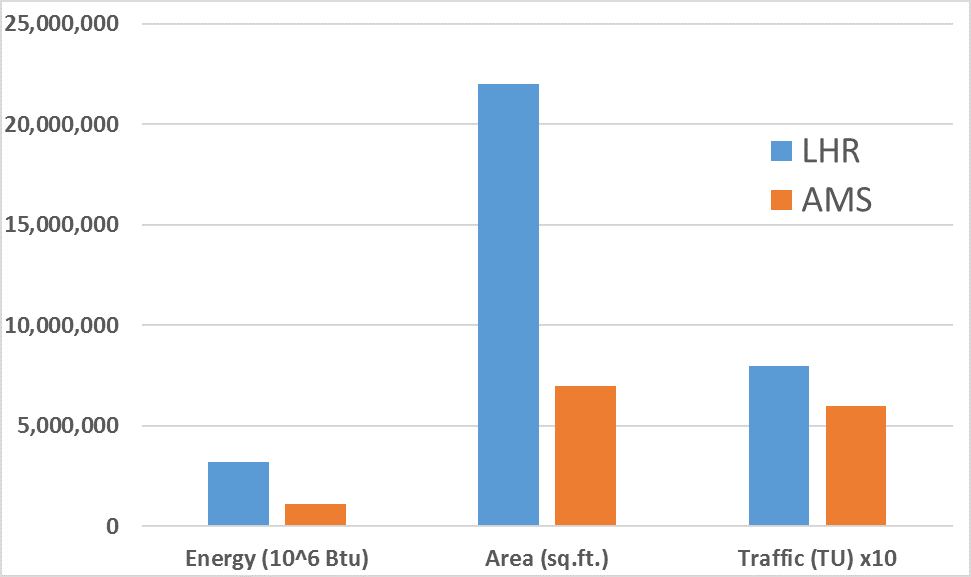
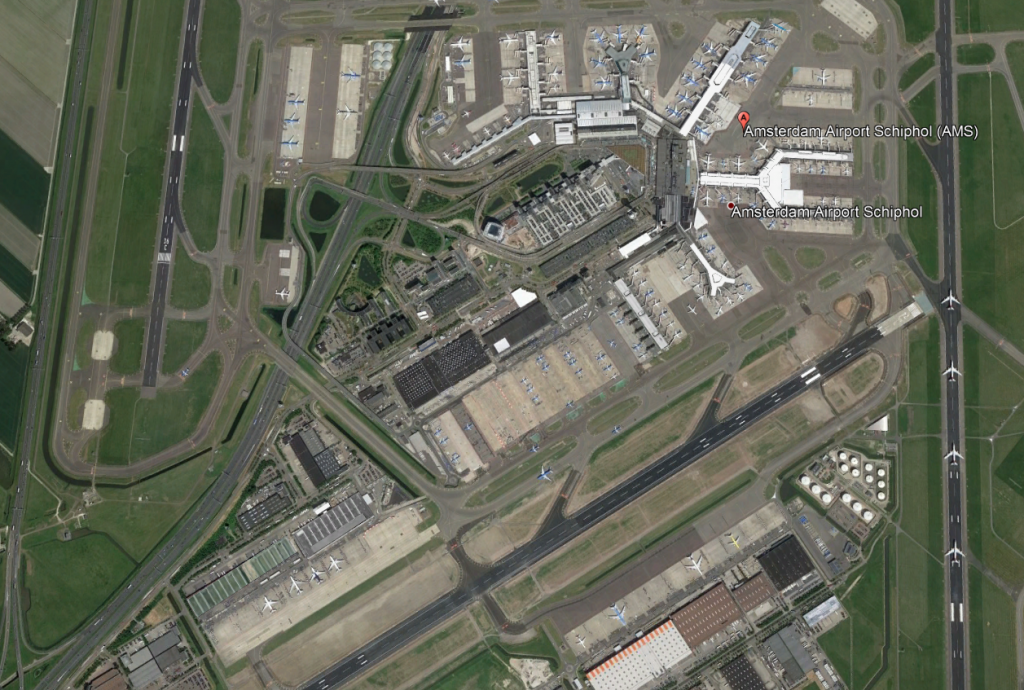
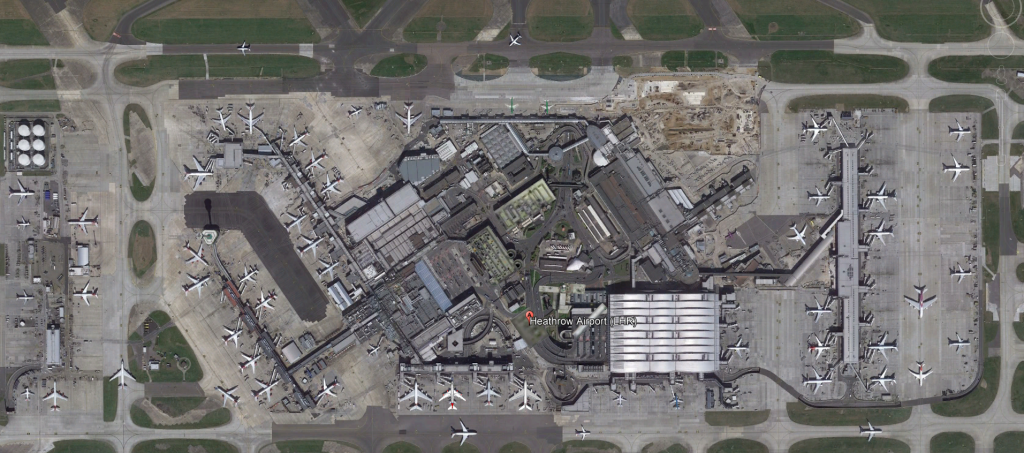
The significant discrepancy in floor area indicates that the building layout of Amsterdam Schiphol is more space-efficient than London Heathrow. This translates to higher energy efficiency for Amsterdam Schiphol. Comparing the terminal layouts of the two airports, as shown in FIGURE 4 and FIGURE 5 below, it is clear that the model of a single terminal with gates radiating off a central model that Amsterdam Schiphol employs is more efficient that the distributed terminal model seen at London Heathrow.
This example illustrates how energy use does not show strong linear correlation with floor area in airports. The difference in layouts between the London and Amsterdam airports exemplifies this. In addition to space efficiency, other factors not present in other building types drive energy use in airport facilities.
Space efficiency can optimize energy use involved with transporting passengers and cargo from one area of the airport to another, but it can also allow for demand-based building systems (mechanical, electrical, plumbing, low-voltage, etc.). By strategically planning programmatic areas of the facility to group spaces with similar operational schedules close to each other, lighting, HVAC and other systems serving large portions of the airport can be shut down when not in use. By providing this system isolation with demand-based operational control (by using occupancy sensors, time clocks or some other method) significant energy savings can be achieved without compromising operations, security, safety or the occupant experience.
Another factor related to energy use is air quality management. With most airports being surrounded by or in direct proximity to runways, air handling units need to provide proper filtration to prevent aircraft and other vehicle exhaust from entering occupied zones. This added filtration increases pressure drop to forced-air duct systems, which drives up fan energy use. Using low pressure drop filters, such as absorber or carbon filters, can help mitigate this issue, but strategic placement of buildings and outside air intakes could potentially provide more benefit.
Carbon Footprint
When considering energy efficiency, infrastructure and O&M upgrades at a facility, oftentimes only site energy end-uses are considered. This is because energy costs can be controlled within the site boundary to a certain degree. But the environmental impact of any facility extends beyond the site boundaries. Carbon footprint, a common metric for total environmental impact, incorporates all energy consuming activity related to the facility, both on- and off-site.
Greenhouse Gas Protocol, a widely accepted set of standards that provides guidance for accounting of greenhouse gas emissions, has established three Scope boundaries for categorizing emissions. Scope 1 consists of any direct emissions from energy using systems within the site boundary. This includes emissions from equipment – things like gas boilers, cogeneration plants, and fossil-fuel vehicles. Scope 2 includes greenhouse gas emissions from energy sources used on site, including off-site electric power and district heating and cooling. Scope 3 encompasses indirect emissions associated with activities that support operation of the facility. Examples of these activities include vehicle emissions from suppliers transporting goods to the site, and waste disposal trucks hauling refuse away from the site. Scope 3 also can take into account emissions caused by customers’ actions related to the facility.
Scope 2 and Scope 3 emissions are more difficult to calculate than Scope 1 emissions, but they represent meaningful portions of the environmental impact of a facility and, moreover, an organization. If an organization places emphasis on reducing its carbon footprint and environmental impact, it should utilize benchmark metrics that take into account Scope 2 and Scope 3 emissions, in addition to site emissions.
Energy management of Scope 2 emissions involves analyzing electricity and thermal energy utilities. In states with deregulated utilities, several independent power producers may be available to purchase wholesale electricity from. These may vary in power sources, and some may have a higher mix of renewable and clean power. Also, the organization can consider purchasing Renewable Energy Credits (RECs) to offset their greenhouse gas emissions.
Reducing the environmental impact of Scope 3 involves “greening” of the supply chain. This can entail finding suppliers who hold sustainability in high regard and continuously monitor and work to improve their own environmental impact. Or it can involve working with existing suppliers and providing suggestions for improving the efficiency of their operations. Operational decisions within the facility can reduce the carbon footprint of suppliers, tenants, and customers as well.
While making capital investments to reduce the carbon footprint associated with Scope 2 and Scope 3 emissions may not have a quick return, revenue can be generated indirectly. If an investment is made in reducing suppliers’ energy use and costs, they could pass some of the savings on to the facility’s organization. Such investments in to greening the supply chain, as well as investments into green power, can also drive revenue as consumers are increasingly looking for organizations to demonstrate a commitment to the environment and to corporate social responsibility.
Just as accounting for Scope 3 carbon emissions is a difficult task, so too is determining appropriate performance metrics. Simply tracking kg of carbon emissions of the supply chain may be sufficient. But creativity on the part of the energy, operations, or sustainability manager may produce advanced metrics much more suitable for certain situations.
While industry standard performance metrics such as EUI and PUE can provide insight into the energy efficiency of many building types, certain facilities can benefit from the use of advanced metrics. Such metrics should incorporate a measure of the core purpose or goal of the facility, or describe the performance of a key system or component that was a point of emphasis in design or is a major focus of an existing building efficiency project. Project teams are encouraged to create their own metrics as appropriate to accurately determine whether a design goal is achieved in operation. Using an industry-established advanced metric such as TU-normalized energy use in airports, however, allows for comparison with existing facilities.
After a phase starting in the early 2000s that saw the building industry worldwide focus on designing energy efficient buildings, the trend is shifting to actual building operation and verifying energy performance. To make best use of the data collected from buildings, databases like ENERGYSTAR Portfolio Manager can be used to monitor building efficiency changes over time, and for comparing efficiency of similar buildings. If appropriate data is included for different building types, strong benchmarks can be established for advanced metrics. With more data points available, the data-set becomes richer and benchmarks become more meaningful. Currently, many advanced metrics must be calculated with data ascertained through case studies. With a limited number of comparison points, it is difficult to determine the relative performance of one building to all buildings of its type. But as databases grow, benchmarks get more meaningful, allowing for more informed design decisions and energy efficiency investments.
*Originally Published for the AEE West Coast Congress
References